The laser scanning projection system can accurately project a virtual laser template onto complex models and parts to guide operators through the process of part fabrication, and the template is the outlines of parts to be placed, aligned or nested. In order to project the virtual template onto a workpiece accurately, it is necessary to obtain the coordinates of six retroreflective targets at least, and the coordinates are in the projected coordinate system and the workpiece coordinate system, respectively. Then calculate the coordinate transformation matrix between the projector coordinate system and the workpiece coordinate system. The numbers and positions of the edge scanning points vary with different scanning methods, and thus different scanning methods will affect the accuracy of center extraction for retroreflective targets. In this paper, we studied different retroreflective target scanning methods, and proposed the sunflower-shaped scanning method and the epicycloid-shaped scanning method. The raster rectangular scanning method can extract a large number of scanning points corresponding to the high reflection area of retroreflective targets, and the center extraction results are reliable. But there are too many scanning points, which result in long scanning time and low acquisition probability. The scanning points of the epicycloid-shaped scanning method are sparsely distributed in the central area and densely distributed in the edge area. This method can effectively save the scanning time and improve the acquisition probability by reducing the number of scanning points in the central area. According to the experimental results, the acquisition probability of the epicycloid-shaped scanning method is 0.89%, which is 6.719 times that of the raster rectangular scanning method. It can achieve the desired effect that more edge scanning points but less total number of scanning points. However, there are obvious position deviations of the edge scanning points when scanning with the epicycloid-shaped scanning method, and that leads to a large error of center extraction. The average center extraction error of the epicycloid-shaped scanning method is 0.227 935 mm. The sunflower-shaped scanning method can also reduce the number of scanning points in the center area of retroreflective target and improve the acquisition probability effectively. According to the experimental results, the acquisition probability of the sunflower-shaped scanning method is improved to 0.96%, which is 6.231 times that of the raster rectangular scanning method, and the probability of obtaining edge scanning points is greater. Moreover, the scanning time of the sunflower-shaped scanning method is 0.055 710 mm, and the center extraction error is small. Therefore, the scanning time of the raster rectangular scanning method is 2.5 s, while the scanning time of sunflower-shaped scanning method is 0.36 s, and the scanning time of epicycloid-shaped scanning method is 0.612 s. Moreover, the acquisition probability of edge scanning points of the raster rectangular scanning method is 0.39%, while the acquisition probability of edge scanning points of the sunflower-shaped scanning method is 0.89%, and the acquisition probability of edge scanning points of the epicycloid-shaped scanning method is 0.96%. Both the sunflower-shaped scanning method and the epicycloid-shaped scanning method can save the scanning time and improve the acquisition probability of edge scanning points. The average center extraction error of the raster rectangular scanning method is 0.091 883 mm, and the average center extraction error of the sunflower-shaped scanning method is 0.055 710 mm. The accuracy of the retroreflective target's center coordinates is higher by using the sunflower-shaped scanning method. In conclusion, the sunflower-shaped scanning method can meet the demands for short scanning time, high acquisition probability and high center extraction accuracy. It could achieve more efficient and accurate scanning for retroreflective targets and improve the working efficiency and positioning accuracy of auxiliary assembly when applied to a laser scanning projection system.
The laser scanning projection system can accurately project a virtual laser template onto complex models and parts to guide operators through the process of part fabrication,and the template is the outlines of parts to be placed,aligned or nested[1-9]. In order to project the virtual template onto a workpiece accurately,it is necessary to obtain the coordinates of six retroreflective targets at least,and the coordinates are in the projected coordinate system and the workpiece coordinate system,respectively. Then calculate the coordinate transformation matrix between the projector coordinate system and the workpiece coordinate system[10]. This process is defined as the "calibration",which can carry out the workpiece's location and orientation with respect to the projector coordinate system prior to performing the actual projection. The laser scanning projection system can redirect the laser beam to project accurate templates by using the abovementioned coordinate transformation matrix and the CAD model of the workpiece. The coordinates of the retroreflective targets in the workpiece coordinate system can be obtained by the CAD model of the workpiece,and that how to get the accurate coordinates of the retroreflective targets in the projector coordinate system is the key problem to be solved.
The circular retroreflective targets are widely used because of their representative geometric features. The center extraction accuracy of the circular retroreflective targets has a great influence on the calibration accuracy,and the scanning methods will affect the center extraction accuracy. Common scanning trajectories or methods include linear scanning trajectory,spiral rectangular scanning trajectory,spiral scanning trajectory,raster rectangular scanning trajectory,circular scanning trajectory,Lissajous scanning trajectory and so on[11]. KAUFMAN S P proposed a raster rectangular scanning method for laser scanning projection systems[12]. WEI Yinsheng et al. analyzed and simulated the scanning trajectories often used in target-tracking radar[11]. ZHANG Yu et al. conducted a simulation on different scanning methods of the ground antenna for the acquisition probability[13]. In general,the design of a scanning method should meet the demands for short scanning time(t),high acquisition probability of edge scanning points(Pa)and high center extraction accuracy. In order to reduce the scanning time consuming,improve Pa and obtain the centers of retroreflective targets more accurately,several scanning methods are studied in this paper,and the different scanning methods are evaluated by the evaluation parameters t,Pa and the center extraction accuracy.
1 Center extraction and center extraction error of retroreflective targets
1.1 Center extraction
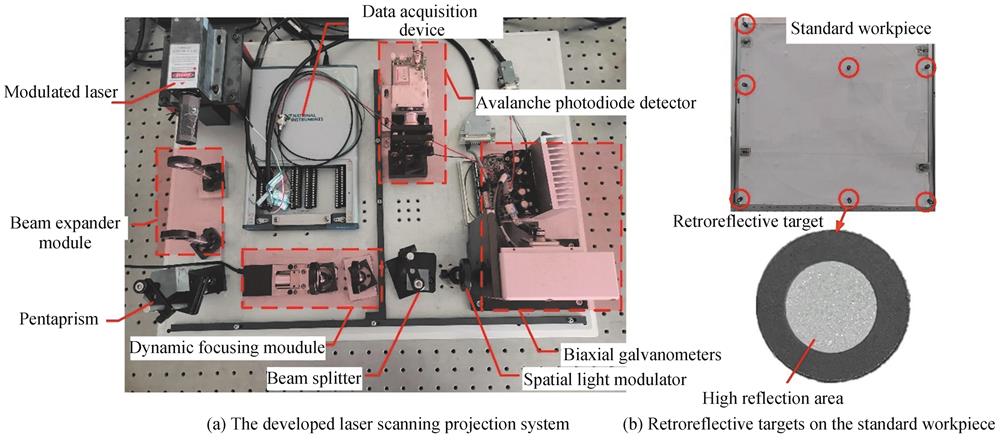
The developed setup of a laser scanning projection system is shown in Fig. 1. The developed laser scanning projection setup mainly consists of a modulated laser,a beam expander module,a pentaprism,a dynamic focusing module,a beam splitter,biaxial galvanometers,a photoelectric detection module,a data acquisition module and retroreflective targets[14]. Fig. 1(b)shows circular retroreflective targets on the standard workpiece. The retroreflective targets perform high reflectance characteristics at the high reflection area around the center. The high reflection area is made of glass microspheres,which can reflect the incident light along the incident direction[15],and the radius of the high reflection area is about 3 mm.
In order to obtain the center coordinates of retroreflective targets in the projector coordinate system,the laser beam is controlled by the biaxial galvanometers to scan areas around the retroreflective targets. Fig. 2 shows the flow chart of center calculation. The horizontal deflection angles H and the vertical deflection angles V of the biaxial galvanometers corresponding to all scanning points are recorded. The light intensity signals reflected by all the scanning points are acquired by the photoelectric detector,and the light signals are converted into voltage signals by the data acquisition module. Since the light intensity reflected from the high reflection area is higher than that of other areas,the corresponding voltage U is also higher than that of other areas. According to this characteristic,all the scanning points can be divided by a threshold voltage(T). If the voltage of a scanning point is less than T,the scanning point hasn't scanned the high reflection area of the scanned retroreflective target,and it is removed. If the voltage of a scanning point is bigger than T,the scanning point has scanned the high reflection area of the retroreflective target,and it remains. The threshold voltage(T)setting can evaluate whether a scanning point has scanned the high reflection area of a retroreflective target. However,due to the influence of the stability of laser light source,the noise signal of photoelectric detection module,the material of retroreflective targets,the position of retroreflective targets and ambient light,it is difficult to set an accurate and uniform T. Therefore,threshold values should be extracted in the same environment before scanning of every cooperative target. The biaxial galvanometers were driven to redirect the laser beam to the non-high reflection area around the retroreflective target. Then the non-high reflection area was scanned. Finally,the maximum voltage value of all the scanning points was extracted and set as T to evaluate whether a scanning point had scanned the high reflection area of the retroreflective target. For example,Fig. 3(a)shows the voltage U and the corresponding deflection angles H and V of the biaxial galvanometers around a retroreflective target. X axis and Y axis represent the horizontal deflection angle H and the vertical deflection angle V of the biaxial galvanometers respectively,and Z axis represents U of each scanning point. It can be seen that the maximum value of U is 0.014 7 V. Therefore,0.014 7 V is set as T when scanning the retroreflective target in the same environment. Next,the remained scanning points can be used to extract the boundaries of retroreflective targets according to the Delaunay triangulation method. Finally,the coordinates of each retroreflective target's center can be calculated by the least-squares method,and the coordinates are expressed by deflection angles(H,V)of the biaxial galvanometers.
Fig. 3(b)shows the deflection angles H,V of the biaxial galvanometers and the voltages U corresponding to all of the scanning points. Fig. 3(c)shows scanning points of the retroreflective target's high reflection area,and Fig. 3(d)shows scanning points of the high reflection area's boundary and(H,V)corresponding to the retroreflective target's center.
1.2 Center extraction error
Center extraction of the retroreflective target requires several processes,such as scanning retroreflective target,setting threshold,edge detection and center extraction,which would affect the center extraction. In order to verify the accuracy of the calculated center coordinates of each retroreflective target,the galvanometers are driven to the calculated deflection angles and redirect the laser beam to the "center" of the previously scanned retroreflective target. Then the image of the retroreflective target and the projected laser spot is taken by an industrial camera. As verified by our previous studies,coordinates of both the retroreflective target's center and the laser spot's center can be calculated by the least-squares method [14],and the distance between the two centers can be the center extraction error.
The center extraction error calculation flow chart is shown in Fig. 4. Firstly,the image of the retroreflective target with the projected laser spot is converted to a grayscale image. Fig. 5(a)is the retroreflective target with the laser spot,and Fig. 5(b)is the grayscale image of Fig. 5(a). The intensity of the laser is constant all the time. Due to the different reflected light intensity of the laser spot,the high reflection area of the retroreflective target and other areas,the corresponding gray value varies greatly. Therefore,the Canny edge detection algorithm is adopted to detect the edge of the retroreflective target's high reflection area and the edge of the laser spot. In Fig. 5(c),the outer circle edge is the edge of the retroreflective target's high reflection area,and the inner circle edge is the edge of the laser spot. Then,the Delaunay triangulation method is used to extract the outer edge and inner edge in Fig. 5(c). Fig. 5(d)shows the outer edge,which represents the edge of the retroreflective target's high reflection area,and Fig. 5(e)shows the inner edge,which represents the edge of laser spot. Finally,two circles are respectively fitted according to the edge of the retroreflective target's high reflection area and the edge of the laser spot by the least-squares method,and thus the centers of the two fitting circles can be calculated. As it is shown in Fig. 5(f),“+” represents the center of the retroreflective target,and "*" represents the center of the projected laser spot,which is the calculated "center" of the retroreflective target. The upper right corner is the enlarged view of the center area,and the distance between "+" and "*" is the error of the two centers.
Figure 4.Flow chart of the center extraction error calculation.
Common scanning trajectories include linear scanning trajectory,spiral rectangular scanning trajectory,spiral scanning trajectory,raster rectangular scanning trajectory,circular scanning trajectory,Lissajous scanning trajectory and so on[11]. Scanning points are arranged according to the scanning trajectory. Thus the number of the scanning points corresponding to the edge of retroreflective target's high reflection area varies with different scanning methods,and the positions of the edge scanning points are also different. The coordinates of different edge scanning points are utilized to calculate the center coordinates of the retroreflective target. As shown in Fig. 6(a),when the extracted edge scanning point Ascan can scan the retroreflective target's edge Aactual accurately,the extracted center of the retroreflective target can be accurate. However,if the extracted edge scanning point Bscan fails to scan the retroreflective target's edge Bactual accurately,the coordinate of Bscan would be mistaken for the coordinate of Bactual when calculating the center of the retroreflective target,which would reduce the accuracy of center extraction. Therefore,the scanning and edge extraction methods would affect the retroreflective target's center extraction accuracy. In order to obtain more accurate coordinates of the retroreflective target's center,several methods for retroreflective targets scanning are studied in this paper while the same threshold setting method,edge extraction method and center fitting method will be used. Fig. 6 shows the schematic diagram of scanning retroreflective targets with different methods,and the trajectories are shown in green.
Figure 6.Scanning retroreflective targets with different scanning methods
The scanning methods should meet the demands for short t,high Pa and high center extraction accuracy. The laser scanning projection system scans the retroreflective target by deflecting the biaxial galvanometers. Each scanning point corresponds to a pair of deflection angles(H,V)of the galvanometers,and the galvanometers are driven by series of commands at equal time increment to redirect the laser beam from one scanning point to another scanning point continually. The scanning time t can be calculated as Eq.(1),where n is the total number of the scanning points of a scanning method,and f is the sampling rate of control signal for driving the biaxial galvanometers. Therefore,t is in proportion to the number of the scanning points when f is fixed. The fewer the scanning points,the shorter the scanning time.
The acquisition probability of edge scanning points(Pa)is defined as a ratio,and it can be calculated as Eq.(2),where ne is the number of the scanning points which scan the high reflection area's edge,and n is the total number of the scanning points. Increasing the number of edge scanning points and reducing the total number of scanning points would contribute to increasing Pa.
In conclusion,the scanning time would be saved by reducing the total number of the scanning points. At the same time,the Pa would be increased by increasing the number of effective edge scanning points. Therefore,the existing scanning method is analyzed by the parameters t and Pa,and new scanning methods are proposed.
2.1 Raster rectangular scanning method
KAUFMAN S P proposed a raster rectangular scanning method for laser scanning projection systems[11]. The laser beam is projected on the surface of the workpiece and the progressive scanning is carried out around the retroreflective target. The intervals between the scanning points are the same,and the total number of the scanning points is fixed.
Fig. 6(a)shows the schematic diagram of scanning retroreflective targets with the raster rectangular scanning method,in which the laser beam scanning trajectory is shown in green. The raster rectangular scanning method is one of the most commonly used scanning methods,with the advantages of a wide scanning range and simple operation. The raster rectangular scanning trajectory is composed of a horizontal scanning trajectory and a vertical scanning trajectory. There are 25 straight line segments in the horizontal and vertical direction respectively,and 500 scanning points with equal intervals are on each line. Therefore,the number of scanning points is 25 000 in total. When the sampling rate of control signal for driving the biaxial galvanometers is 10 000 samples/s,t is 25 000/10 000=2.5 s.
2.2 Epicycloid-shaped scanning method
Epicycloid is the trajectory described by a point on the circumference of a circle as the circle rolls along the outside of another fixed circle without sliding. The mathematical expression of the epicycloid is
where a is the radius of the fixed circle,b is the radius of the moving circle. The center of the moving circle's center is defined as Om,and the center of the fixed circle's center is defined as Of. θ is the angle between the line connecting Om and Of and the positive X axis. Fig. 7 shows epicycloids generated by different parameters. It can be seen that the size and shape of the epicycloid vary with the fixed circle's radius a and the moving circle's radius b. If the ratio of a to b is constant,the shape of the epicycloid remains constant while its size changes.
The ratio of a/b of epicycloid is determined by comparing different parameter combinations. Fig. 6(b)shows the schematic diagram of scanning retroreflective targets with the epicycloid-shaped scanning method,in which the trajectory is shown in green. It can be seen that there are no scanning points in the center area of the scanning trajectory,which can reduce the total number of scanning points effectively. Appropriate parameters of the epicycloid-shaped scanning method are calculated according to the projection distance and the radius of the retroreflective target when conducting the experiment. In this study,the parameters are a=0.012,b=0.013 6,and the value range of θ is(0,34π]. One scanning point is set for every one degree in θ,so that the scanning method has 34×180=6 120 scanning points. The sampling rate of control signal for driving the biaxial galvanometers is 10 000 samples/s,so that t is 6 120/10 000=0.612 s.
2.3 Sunflower -shaped scanning method
The sunflower-shaped curve is a closed curve,and its equation in polar coordinate system is shown as
Eq.(4) can be expressed as Eq.(5) in the rectangular coordinate system.
where β represents the angle between the line,which connect one point on the curve and the center of the curve,and the positive X axis. According to Eq.(4),the maximum value of sunflower-shaped curve’s radius(r)is a+b and the minimum value of r is a-b. a determines the average value of r,and b controls the range of r. c determines the number of cycles in which r changes in magnitude,and there are c cycles of changes in the magnitude of r in one closed curve. Fig. 8 shows sunflower-shaped curves with different parameters.
Figure 8.Sunflower-shaped curves with different parameters
Fig. 6(c)shows the schematic diagram of scanning retroreflective targets with the sunflower-shaped scanning method,in which the trajectory is shown in green. It can be seen that there are no scanning points in the center area when appropriate parameters are adopted,and it is expected to reduce the total number of scanning points dramatically. Appropriate parameters of the epicycloid-shaped scanning method are calculated according to the projection distance and the radius of the retroreflective target when conducting the experiment. In this study,the parameters of the sunflower-shaped curve are a=0.03,b=0.015, c=50,and the range of β is(0,2π]. A scanning point is set for every 0.1° in β,and there are 2×180/0.1=3 600 scanning points in total. The sampling rate of control signal for driving the biaxial galvanometers is 10 000 samples/s,so that t is 3 600/10 000=0.36 s.
3 Experiment
3.1 Experiment of raster rectangular scanning method
Fig. 6(a)shows the schematic diagram of scanning retroreflective targets with the raster rectangular scanning method,in which the trajectory is shown in green. The voltage U corresponding to every scanning point can be obtained by the data acquisition module after scanning the retroreflective target on the standard workpiece,and H and V of the biaxial galvanometers can be recorded as well. Fig. 9 shows the voltage U and the coordinates of the six retroreflective targets P1,P2,P3,P4,P5 and P6,and the coordinates are expressed by the biaxial galvanometers' deflection angles. X axis and Y axis represent the horizontal deflection angle H and the vertical deflection angle V of the biaxial galvanometers respectively,and Z axis represents U corresponding to the scanned position of each scanning point.
Figure 9.The voltage and coordinates of retroreflective targets with raster rectangular scanning method
An appropriate T based on U was set by the method mentioned in the Section 1 to extract the scanning points corresponding to the retroreflective target's high reflection area. The biaxial galvanometers' deflection angles H and V corresponding to the scanning points in the retroreflective target's high reflection area are shown in Fig. 10. Before scanning the retroreflective target,the retroreflective target should be positioned roughly so that the position of scanning graph should can be adjusted to the retroreflective target according the rough position. As shown in Fig. 11,the rough positioning of the left target is more accurate relatively than that of the right one,and the scanning graphic overlaps with the retroreflective target basically. The right figure shows that the scanning graphic is offset,leads to a decrease in the position coincidence between the scanning graphic and the retroreflective target. Part of the retroreflective target edge cannot be scanned. Therefore,some edge scanning points cannot be extracted,which may affect the center extraction accuracy. The rough position error of P3 is large relatively so that some scanning points are missing.
Figure 10.Scanning points of high reflection area with raster rectangular scanning method
Extract the edge points in Fig. 10 by the Delaunay triangulation method. Fig. 12 shows the coordinates of edge scanning points. The numbers of the edge scanning points of the six retroreflective targets were 37,33,33,37,37 and 37,respectively. Therefore,Pa of the raster rectangular scanning method is 0.14%,and it can be calculated as
Figure 12.Edge scanning points of retroreflective targets with raster rectangular scanning method
The deflection angles H and V of the biaxial galvanometers corresponding to the center of the scanned retroreflective target can be calculated by the least-squares method with the edge scanning points in Fig. 12. In order to calculate the center extraction error when using the raster rectangular scanning method,the galvanometers were controlled to reflect the laser beam to the calculated "center" of the retroreflective target. The image of the retroreflective target with the projected laser spot was taken by an industrial camera,and the error between the retroreflective target's center and the laser spot's center can be calculated by the method mentioned in section 2.2. Fig. 13 shows the results of six retroreflective targets,and the upper right corner is the enlarged view of the center. "+" represents the retroreflective target's center,and "*" represents the laser spot's center,which is the calculated "center" of the retroreflective target scanned with the raster rectangular scanning method. The pixel position of the retroreflective target's center,the pixel position of the laser spot's center and the distance between the two centers are shown in Table 1. It can be seen that the distances between the calculated "center" and the actual center are less than 0.15 mm.
Figure 13.Center extraction errors of retroreflective targets with raster rectangular scanning method
Raster rectangular scanning method benefits for wide scanning range,uniformly-spaced and high reliability of the calculation result. However,it has too many scanning points and takes a long time for scanning. Moreover,only the scanning points at the edge of the retroreflective target's high reflection area are extracted when calculating the center coordinates,while large number of scanning points in the retroreflective target's high reflection area cannot be utilized effectively. In order to save t and improve Pa,the epicycloid-shaped scanning method and sunflower-shaped scanning method are proposed to reduce the number of scanning points in high reflection area of the retroreflective target and increase the number of edge scanning points.
3.2 Experiment of epicycloid-shaped scanning method
Fig. 6(b)shows the schematic diagram of scanning retroreflective targets with the epicycloid-shaped scanning method,in which the trajectory is shown in green. It can be seen that the scanning points of this scanning trajectory are sparsely distributed in the central area and densely distributed in the edge area,and that is expected to save t and improve Paeffectively.
Scanning with the epicycloid-shaped scanning method is processed in the same way as scanning with the raster rectangular scanning method. Fig. 14 shows the voltage U and the coordinates of the six retroreflective targets P1,P2,P3,P4,P5 and P6.
Figure 14.The voltage and coordinates of retroreflective targets with epicycloid-shaped scanning method
An appropriate T based on U was set to extract the scanning points corresponding to retroreflective target's high reflection area. The biaxial galvanometers' deflection angles H and V corresponding to the scanning points in the retroreflective target's high reflection area are shown in Fig. 15.
Figure 15.Scanning points of high reflection area with epicycloid-shaped scanning method
Extract the edge points in Fig. 15 by the Delaunay triangulation method. Fig. 16 shows the coordinates of edge scanning points. The numbers of the edge scanning points of the six retroreflective targets were 67,49,83,41,50 and 62,respectively. Therefore,Pa of the epicycloid-shaped scanning method is 0.96%,and it can
Figure 16.Edge scanning points of retroreflective targets with epicycloid-shaped scanning method
Pa of the epicycloid-shaped scanning method is 6.719 times that of the raster rectangular scanning method,and Pa is improved obviously. The epicycloid-shaped scanning method can obtain more edge scanning points in case of less total scanning points.
The deflection angles H and V of the biaxial galvanometers corresponding to the center of the scanned retroreflective target can be calculated by the least-squares method with the scanning points in Fig. 16. In order to calculate the center extraction error when using the epicycloid-shaped scanning method,the galvanometers were controlled to reflect the laser beam to the calculated "center" of the retroreflective target. Then the error between the retroreflective target's center and the laser spot's center can be calculated by the method mentioned in the Section 1. Fig. 17 shows the results of six retroreflective targets,and the upper right corner is the enlarged view of the center. "+" represents the retroreflective target's center,and "*" represents the laser spot's center. The pixel position of the retroreflective target’s center,the pixel position of the laser spot's center and the distance between the retroreflective target's center and the laser beam's center are shown in Table 2.
Figure 17.Center extraction errors of retroreflective targets with epicycloid-shaped scanning method
Rough positioning is of great significance to improve the accuracy of center extraction. It can be seen from Table 2 that the maximum center extraction error is the error of P3,which is 0.58 mm,and the errors of P2,P5 are bigger than 0.15 mm(the abovementioned maximum error of center extraction when using the raster rectangular scanning method). The effect of rough positioning on retroreflective target scanned by epicycloid-shaped scanning is greater than that of raster rectangular scanning method. Part of the edge of the retroreflective target weren't scanned by laser because the area covered by epicycloid-shaped scanning trajectory deviated greatly from the center of the retroreflective target. Therefore,the scanning points of high reflection area are considered to be the scanning points of high reflection area's edge when calculating the center of the retroreflective target,and the deviations of edge scanning points would increase errors to calculating the center of the retroreflective target. When scanning the retroreflective target P3,the overlapping region between the scanning trajectory and the retroreflective target is the smallest,so the deviations of the edge scanning points are the largest,and the error of center extraction is the largest as well. This situation could happen when scanning the retroreflective target with the other scanning methods,and it can be corrected by scanning the retroreflective target with more accurate position of retroreflective target's center.
Since the distances of two adjacent points on the epicycloid-shaped scanning trajectory from the fixed circle's center vary greatly,the actual scanning positions of the scanning points in Fig. 16 may have large distances from the high reflection area's edge,and that leads to obvious deviations of edge scanning points and a large error in center extraction. Increasing the number of scanning points could improve the density of scanning points on the trajectory,and the distance between the scanning points would become smaller,so as to improve the accuracy of center extraction. However,the increasing of the number of scanning points would lead to longer t,and Pawould decrease.
3.3 Experiment of sunflower-shaped scanning method
Fig. 6(c)shows the schematic diagram of scanning retroreflective targets with the sunflower-shaped scanning method,in which the trajectory is shown in green. It can be seen that the center of this scanning trajectory has no scanning points,and that is expected to reduce t and improve Pa.
The voltage U corresponding to every scanning point can be obtained after scanning the retroreflective target with the sunflower-shaped scanning method,and H and V of the galvanometers can be recorded as well. Fig. 18 shows the voltage U and the coordinates of the six retroreflective targets.
Figure 18.The voltage and coordinates of retroreflective targets with sunflower-shaped scanning method
An appropriate T based on U was set to extract the scanning points corresponding to retroreflective target's high reflection area. The biaxial galvanometers' deflection angles H and V corresponding to the scanning points in the retroreflective target's high reflection area are shown in Fig. 19.
Figure 19.Scanning points of high reflection area with sunflower-shaped scanning method
Extract the edge points in Fig. 19 by the Delaunay triangulation method. Fig. 20 shows the edge scanning points. The numbers of the edge scanning points of the six retroreflective targets were 30,31,29,35,36 and 31,respectively. Therefore,Pa of the sunflower-shaped scanning method is 0.89%,and it can be calculated as
Figure 20.Edge scanning points of retroreflective targets with sunflower-shaped scanning method
Pa of the sunflower-shaped scanning method is 6.231 times that of the raster rectangular scanning method,and Pa is improved markedly. The sunflower-shaped scanning method can obtain more edge scanning points in case of less total scanning points.
The deflection angles H and V of the galvanometers corresponding to the center of the scanned retroreflective target can be calculated by the least-squares method. The galvanometers were controlled to reflect the laser beam to the calculated "center" of the retroreflective target,and the error between the retroreflective target's center and the laser spot's center can be calculated. Fig. 21 shows the center extraction errors of six retroreflective targets,and the upper right corner is the enlarged view of the center. "+" represents the retroreflective target's center,and "*" represents the laser spot's center. The pixel position of the retroreflective target's center,the pixel position of the laser spot's center and the distance between the two centers are shown in Table 3. It can be seen from Table 3 that the deviations between the two centers are small,and all of them are less than 0.10 mm.
Figure 21.Center extraction errors of retroreflective targets with sunflower-shaped scanning method
As shown in Table 4,t,Pa and average center extraction error of the three different scanning methods are described. The experimental results show that the raster rectangular scanning method can extract a large number of scanning points corresponding to the high reflection area of retroreflective targets,and the center extraction results are reliable. But there are too many scanning points,which result in long t and low Pa. The scanning points of the epicycloid-shaped scanning method are sparsely distributed in the central area and densely distributed in the edge area,and this method can effectively save t and improve Pa by reducing the number of scanning points in the central area. According to the experimental results,Pa of the epicycloid-shaped scanning method is 6.719 times that of the raster rectangular scanning method. It can achieve the desired effect that more edge scanning points but less total number of scanning points. However,there are obvious position deviations of the edge scanning points when scanning with the epicycloid-shaped scanning method,and that leads to a large error of center extraction. The sunflower-shaped scanning method can also reduce the number of scanning points in the center area of retroreflective target and improve Pa effectively. According to the experimental results, Pa of the sunflower-shaped scanning method is improved to 6.231 times that of the raster rectangular scanning method,and the probability of obtaining edge scanning points is greater. Moreover,t of the sunflower-shaped scanning method is the shortest,and the center extraction error is small. In conclusion,the sunflower-shaped scanning method can meet the demands for short t,high Pa and high center extraction accuracy. It could achieve more efficient and accurate scanning for retroreflective targets and improve the working efficiency and positioning accuracy of auxiliary assembly when applied to a laser scanning projection system.
Table Infomation Is Not Enable
4 Conclusion
In this paper,we proposed two different scanning methods for circular retroreflective target scanning and center extraction,and they are the epicycloid-shaped scanning method and the sunflower-shaped scanning method. The feasibility of the raster rectangular scanning method and the two proposed scanning methods are verified by experiments,and then evaluation parameters,such as scanning time t,acquisition probability of edge scanning points Paand center extraction accuracy,are selected to evaluate the advantages and disadvantages of different scanning methods. Experimental results show that the sunflower-shaped scanning method could be more efficient and accurate scanning for retroreflective targets and improve the working efficiency and positioning accuracy of auxiliary assembly when applied to a laser scanning projection system.
References
[1] D R KURT. Laser projection with dynamically adaptable focus.
[2] U ALEXANDER, H SVEN, R DANIEL. Development of projection based assistance system for manual assembly, 365-370(2016).
[3] Maosheng HOU, Jiqiang LIU, Dali LIU et al. Research on calibration technology of laser scanning projection system based on laser ranging. Chinese Journal of Lasers, 46, 1004002(2019).
[5] Maosheng HOU, Yuqing CHEN, Zhengxue SHI et al. Self-calibration method of laser scanning projection system combined with monocular vision. Acta Photonica Sinica, 50, 0212002(2021).