
Zijian ZHU, Qi LIU, Hongfen CHEN, Guiyang ZHANG, Fukuan WANG, Ju HUO. Infrared Small Vehicle Detection Based on Parallel Fusion Network[J]. Acta Photonica Sinica, 2022, 51(2): 0210001
- Acta Photonica Sinica
- Vol. 51, Issue 2, 0210001 (2022)
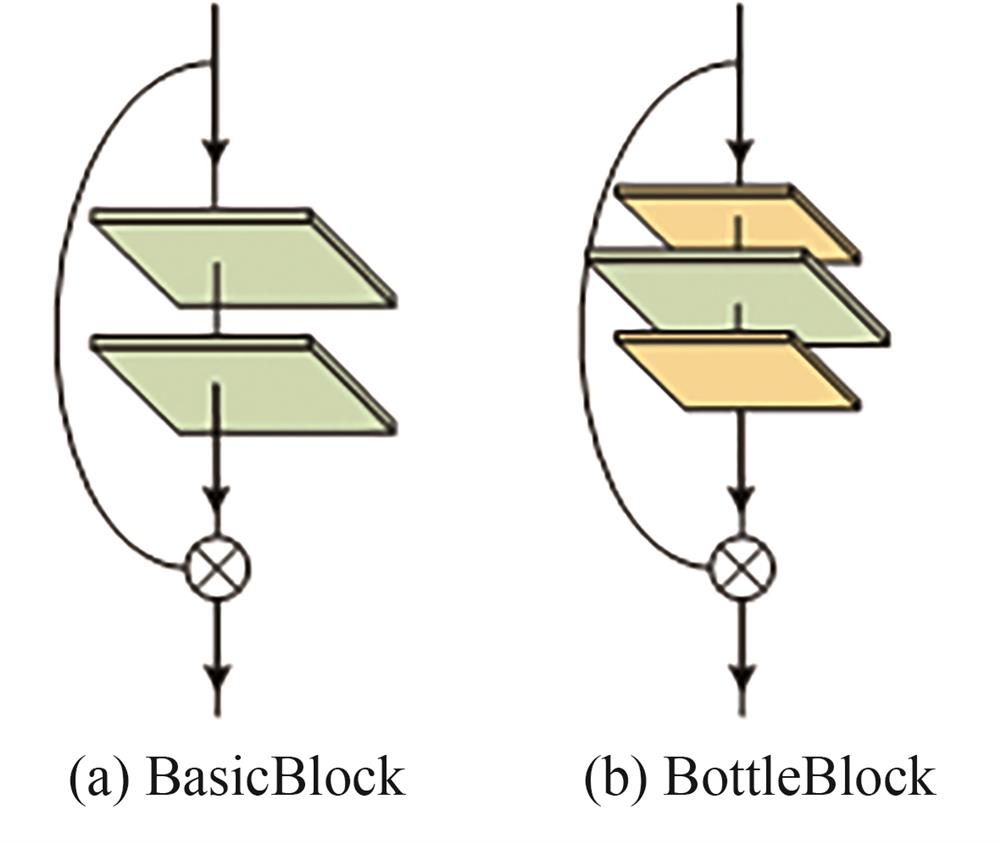
Fig. 1. Residual block
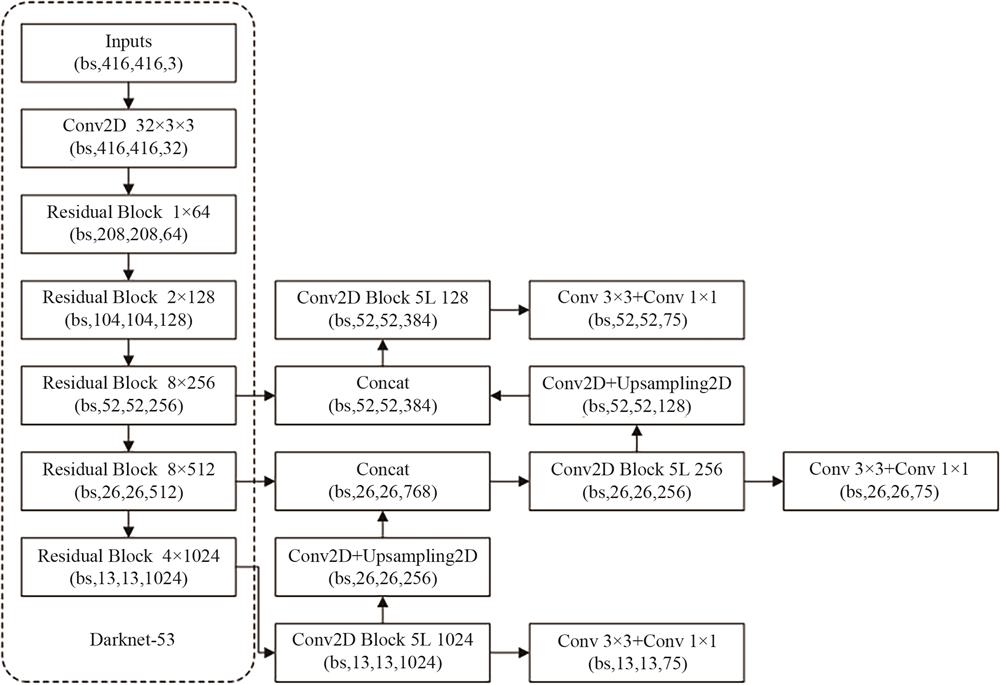
Fig. 2. The backbone and feature map of YOLOv3
Fig. 3. PaRNet structure diagram
Fig. 4. Parallel residual block designing diagram
Fig. 5. Schematic diagram of the receptive field of channel fusion strategy
Fig. 6. Architecture of PaRNet-35 and PaRNet-51
Fig. 7. Deconvolution and upsampling
Fig. 8. Diagram of feature fusion based on cross-layer connection
Fig. 9. The change of TOP-1 value in different networks with the training epochs on CIFAR-10
Fig. 10. The change of TOP-1 value in different networks with the training epochs on CIFAR-100
Fig. 11. Part of the frame image of the meeting
Fig. 12. Part of the frame image of the multiple fuzzy targets
Fig. 13. Detection visualization
|
Table 1. Performance of different networks on CIFAR-10
|
Table 2. Performance of different networks on CIFAR-100
| |||||||||||||||||||||||||||||||||||||||||||||||||||||||||||||||||||||||||||||||
Table 3. Calculation of evaluation index values in different sequence scenarios
|
Table 4. Comparison of different algorithm(without deep learning)
|
Table 5. Comparison of different algorithm(with deep learning)

Set citation alerts for the article
Please enter your email address
© Copyright 2018-2021 | Chinese Laser Press. All Rights Reserved 沪ICP备15018463号-20