• Photonics Research
  • Vol. 5, Issue 3, 168 (2017)
Martino Bernard1、2、*, Fernando Ramiro Manzano2, Lorenzo Pavesi2, Georg Pucker1, Iacopo Carusotto3, and Mher Ghulinyan1
Author Affiliations
  • 1Centre for Materials and Microsystems, Fondazione Bruno Kessler, I-38123 Povo, Italy
  • 2Department of Physics, Nanoscience Laboratory, University of Trento, I-38123 Povo, Italy
  • 3INO-CNR BEC Center and Department of Physics, University of Trento, I-38123 Povo, Italy
  • show less
    DOI: 10.1364/PRJ.5.000168 Cite this Article Set citation alerts
    Martino Bernard, Fernando Ramiro Manzano, Lorenzo Pavesi, Georg Pucker, Iacopo Carusotto, Mher Ghulinyan. Complete crossing of Fano resonances in an optical microcavity via nonlinear tuning[J]. Photonics Research, 2017, 5(3): 168 Copy Citation Text show less
    Schematic representation of the mode-crossing possibilities. (a) Azimuthal modes of two radial families progressively shift at each increment of the azimuthal number due to the difference in FSR, possibly going through a crossing. (b) Continuous tuning of a doublet of resonances may be obtained via nonlinearities, such as a localized thermo-optic effect.
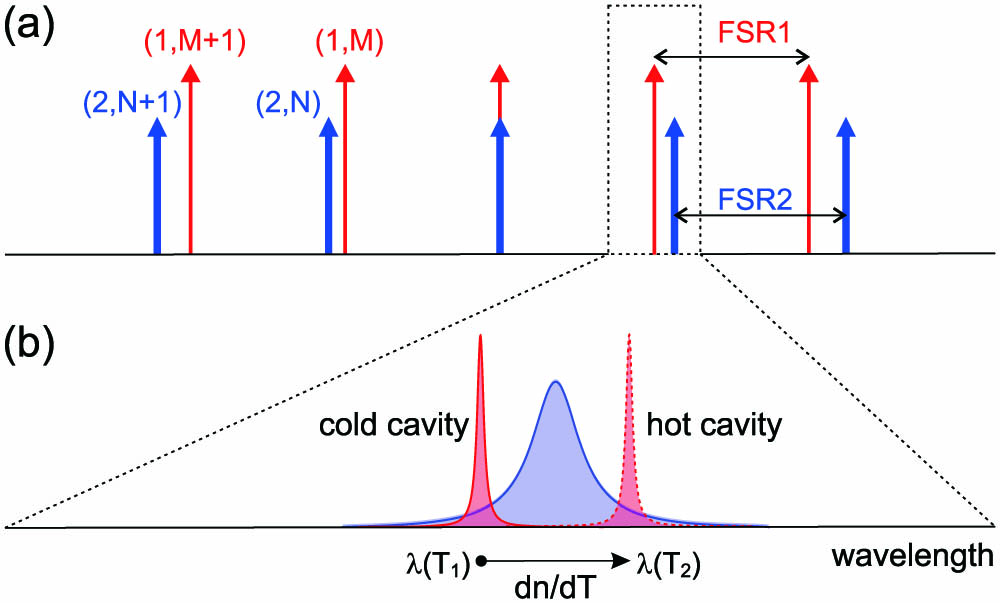
    Fig. 1. Schematic representation of the mode-crossing possibilities. (a) Azimuthal modes of two radial families progressively shift at each increment of the azimuthal number due to the difference in FSR, possibly going through a crossing. (b) Continuous tuning of a doublet of resonances may be obtained via nonlinearities, such as a localized thermo-optic effect.
    Simulated thermal distribution generated by (a) the first and (b) the second optical radial family modes. The contour lines show the modes’ electric field profiles.
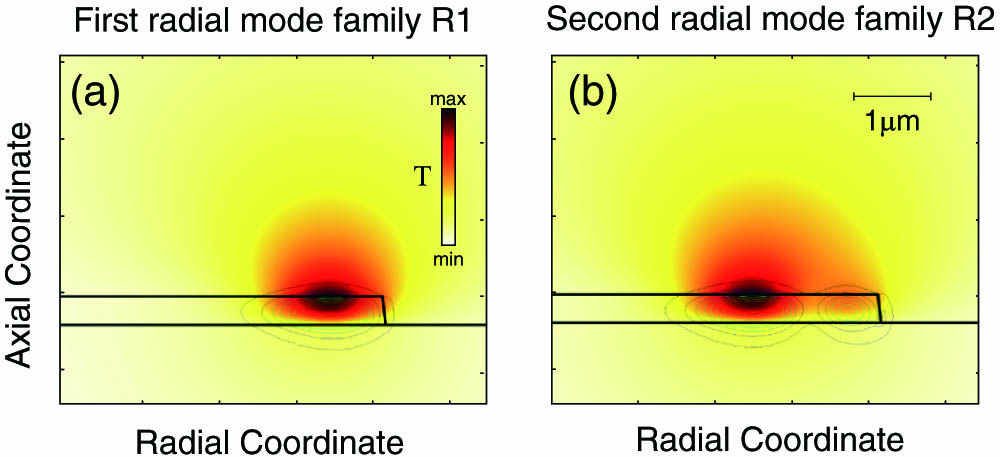
    Fig. 2. Simulated thermal distribution generated by (a) the first and (b) the second optical radial family modes. The contour lines show the modes’ electric field profiles.
    Resonant line shape modification under a sweeping pump in the presence of optical nonlinearity. The cold cavity spectrum (dashed line) is obtained with a weak probe. When sweeping the spectrum using a high-power laser (solid line), the resonance shifts progressively due to the increasing nonlinear effect, resulting in a spectrum with an apparent discontinuity, where the cavity mode de-locks from the pump laser.
    Fig. 3. Resonant line shape modification under a sweeping pump in the presence of optical nonlinearity. The cold cavity spectrum (dashed line) is obtained with a weak probe. When sweeping the spectrum using a high-power laser (solid line), the resonance shifts progressively due to the increasing nonlinear effect, resulting in a spectrum with an apparent discontinuity, where the cavity mode de-locks from the pump laser.
    Experimental setup. A tunable laser amplified with an EDFA is mixed with the broadband signal of a BOA and shone into the sample with a taper fiber. The output also is collected with a taper fiber, split, and fed to an OSA and a broadband germanium detector.
    Fig. 4. Experimental setup. A tunable laser amplified with an EDFA is mixed with the broadband signal of a BOA and shone into the sample with a taper fiber. The output also is collected with a taper fiber, split, and fed to an OSA and a broadband germanium detector.
    Experimental cold cavity spectrum of the resonator. Three azimuthal modes are present for the families R1, R2, and R3. The relative position of the R1–R2 doublet peaks transforms across the spectrum due to the difference in the respective FSRs.
    Fig. 5. Experimental cold cavity spectrum of the resonator. Three azimuthal modes are present for the families R1, R2, and R3. The relative position of the R1R2 doublet peaks transforms across the spectrum due to the difference in the respective FSRs.
    Results of the pump and probe experiment. Panel (a) shows the cold (dashed) and hot (solid) cavity transmission spectra of the device around the strongly pumped resonance doublet. The thermo-optic nonlinearity, induced by the pumped doublet, also affects the other resonances (b), allowing for a relative detuning of the peaks as shown by the transmission color map. (c) Selected transmission spectra show the transformation of the Fano resonance in the vicinity of the critical phase point, where a complete disappearance of the R1s peak feature takes place (panel C). The probe spectrum time-evolution, together with the pump dynamic transmission is represented in Visualization 1.
    Fig. 6. Results of the pump and probe experiment. Panel (a) shows the cold (dashed) and hot (solid) cavity transmission spectra of the device around the strongly pumped resonance doublet. The thermo-optic nonlinearity, induced by the pumped doublet, also affects the other resonances (b), allowing for a relative detuning of the peaks as shown by the transmission color map. (c) Selected transmission spectra show the transformation of the Fano resonance in the vicinity of the critical phase point, where a complete disappearance of the R1s peak feature takes place (panel C). The probe spectrum time-evolution, together with the pump dynamic transmission is represented in Visualization 1.
    Pump and probe experiments demonstrating a complete crossing of the modes. Panels (a), (b), and (c) represent the same experiment under different input power conditions of 0.5, 1, and 2 W, respectively. (d) The selected spectra, under 2 W pump, demonstrate three cases of the relative detuning, which changes from positive (A) to negative (C) passing through the δω012=0 condition (B). The probe spectrum time evolution, together with the pump dynamic transmission with input power 2.0 W is represented in Visualization 2.
    Fig. 7. Pump and probe experiments demonstrating a complete crossing of the modes. Panels (a), (b), and (c) represent the same experiment under different input power conditions of 0.5, 1, and 2 W, respectively. (d) The selected spectra, under 2 W pump, demonstrate three cases of the relative detuning, which changes from positive (A) to negative (C) passing through the δω012=0 condition (B). The probe spectrum time evolution, together with the pump dynamic transmission with input power 2.0 W is represented in Visualization 2.
    Experimental and simulated data of the pump and probe experiment. (a) Experimental pump transmission spectrum of the loaded cavity (black line) is simulated (dashed red) by inserting the cold cavity fit parameters into Eq. (15). (b) Experimental transmission map as a function of both pump and probe wavelength is shown. (c) Relative coupling η1 among the two radial family modes to the waveguide, extracted from results in panel (b). Successively, η1 is used to compute the Γ and Δ matrices of Eq. (10) to also take into account the changes in the coupling induced by the thermally induced δn(r). Panel (d) shows the transmission map as a function of both pump and probe wavelength using the simulated in (a) pump excitation for Eq. (16).
    Fig. 8. Experimental and simulated data of the pump and probe experiment. (a) Experimental pump transmission spectrum of the loaded cavity (black line) is simulated (dashed red) by inserting the cold cavity fit parameters into Eq. (15). (b) Experimental transmission map as a function of both pump and probe wavelength is shown. (c) Relative coupling η1 among the two radial family modes to the waveguide, extracted from results in panel (b). Successively, η1 is used to compute the Γ and Δ matrices of Eq. (10) to also take into account the changes in the coupling induced by the thermally induced δn(r). Panel (d) shows the transmission map as a function of both pump and probe wavelength using the simulated in (a) pump excitation for Eq. (16).
      R1pR2pR1sR2s
    ηi0.07230.99740.0976*0.9952*
    γjnr[GHz]4.40020.5815.55828.01
    ωjo[THz]194.532194.374192.15191.92
    gii/g111.000.921.000.92
    Δ¯[GHz]186.33193.44
    Γ¯[GHz]24.74918.567
    g12/g110.900.90
    g11[GHz]−150−150
    Table 1. Fit Parameters of the Cold Cavity Spectra of Both Pump and Probe Resonances, Used in the Simulationsa
    Martino Bernard, Fernando Ramiro Manzano, Lorenzo Pavesi, Georg Pucker, Iacopo Carusotto, Mher Ghulinyan. Complete crossing of Fano resonances in an optical microcavity via nonlinear tuning[J]. Photonics Research, 2017, 5(3): 168
    Download Citation