• Chinese Physics B
  • Vol. 29, Issue 8, (2020)
Lun Xiong1、†, Qiang Li1, Cheng-Fu Yang1, Qing-Shuang Xie1, and Jun-Ran Zhang2、3
Author Affiliations
  • 1School of Intelligent Manufacturing, Sichuan University of Arts and Science, Dazhou 635000, China
  • 2Multidiscipline Research Center, Institute of High Energy Physics, Chinese Academy of Sciences, Beijing 100049, China
  • 3School of Physical Sciences, University of Chinese Academy of Sciences, Beijing 100049, China
  • show less
    DOI: 10.1088/1674-1056/ab8c3d Cite this Article
    Lun Xiong, Qiang Li, Cheng-Fu Yang, Qing-Shuang Xie, Jun-Ran Zhang. A high-pressure study of Cr3C2 by XRD and DFT[J]. Chinese Physics B, 2020, 29(8): Copy Citation Text show less
    Crystal structure of Cr3C2 in ambient condition.
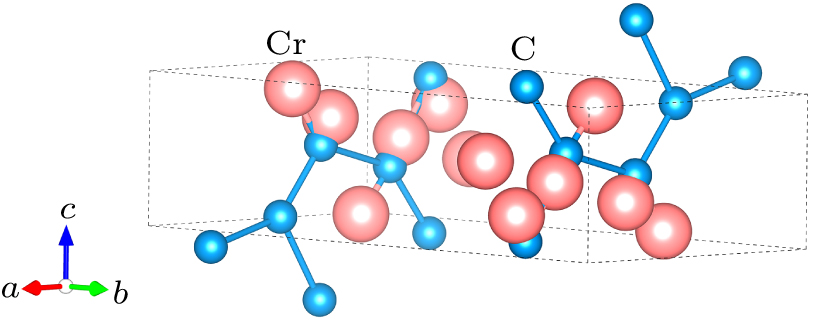
    Fig. 1. Crystal structure of Cr3C2 in ambient condition.
    SEM image of Cr3C2 sample in ambient conditions.
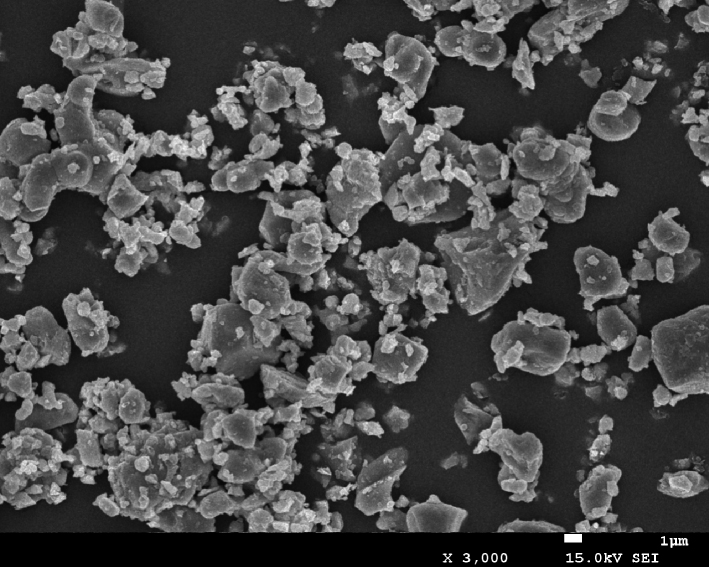
    Fig. 2. SEM image of Cr3C2 sample in ambient conditions.
    Representative powder XRD of Cr3C2 in ambient conditions with each peak marked by corresponding Miller indices, and x-ray wavelength λ = 1.5406 Å.
    Fig. 3. Representative powder XRD of Cr3C2 in ambient conditions with each peak marked by corresponding Miller indices, and x-ray wavelength λ = 1.5406 Å.
    Representative XRD patterns of Cr3C2 under different pressures.
    Fig. 4. Representative XRD patterns of Cr3C2 under different pressures.
    Compressibility of lattice parameters of Cr3C2 and calculation result in generalized-gradient approximation (GGA).
    Fig. 5. Compressibility of lattice parameters of Cr3C2 and calculation result in generalized-gradient approximation (GGA).
    Compression curve of Cr3C2 derived from lattice parameters, with Birch–Murnaghan fitting line based on experimental data (blue) and Birch–Murnaghan equation fitting to theoretical calculation result (red dotted).
    Fig. 6. Compression curve of Cr3C2 derived from lattice parameters, with Birch–Murnaghan fitting line based on experimental data (blue) and Birch–Murnaghan equation fitting to theoretical calculation result (red dotted).
    Calculated band structure of Cr3C2 at (a) 0 GPa, (b) 10 GPa, (c) 20 GPa, and (d) 30 GPa.
    Fig. 7. Calculated band structure of Cr3C2 at (a) 0 GPa, (b) 10 GPa, (c) 20 GPa, and (d) 30 GPa.
    Calculated total DOS and PDOS of Cr3C2 at (a) 0 GPa, (b) 10 GPa, (c) 20 GPa, and (d) 30 GPa.
    Fig. 8. Calculated total DOS and PDOS of Cr3C2 at (a) 0 GPa, (b) 10 GPa, (c) 20 GPa, and (d) 30 GPa.
    SolidsMethodsK0/GPaK0
    Cr3C2present-Exp.292(18)3.25(0.85)
    present-Cal.323(1)GGA
    TiCExp.233,[17] 263,[18] 240[19]
    Cal.252.80,[20] 273,[21] 251,[22] 257,[18] 228,[23] 270[24]4.05[20]
    ZrCExp.234,[18] 223,[25,26] 230,[27] 207,[28] 220[29] 222.88,[20] 237,[21] 217,[30] 224.3,[31] 217.7[32]
    Cal.232,[33] 224,[34] 225,[35] 230.5,[36] 229,[37] 265[23] 217.7,[32] 220.1,[38] 222,[39]4.05,[20] 3.86[34]
    HfCExp.
    Cal.310.33,[20] 228.2,[40] 236,[30] 218,[23] 265[41]2.908,[20] 3.88[40]
    Table 1. Values of bulk modulus (K0) and its derivative with respect to pressure (K0) of carbides obtained with various methods.
    Lun Xiong, Qiang Li, Cheng-Fu Yang, Qing-Shuang Xie, Jun-Ran Zhang. A high-pressure study of Cr3C2 by XRD and DFT[J]. Chinese Physics B, 2020, 29(8):
    Download Citation