• Chinese Journal of Lasers
  • Vol. 45, Issue 4, 407003 (2018)
Yuan Jiangwei, Zhang Chunguang*, Wang Hao, and Shi Lei
Author Affiliations
  • [in Chinese]
  • show less
    DOI: 10.3788/CJL201845.0407003 Cite this Article Set citation alerts
    Yuan Jiangwei, Zhang Chunguang, Wang Hao, Shi Lei. Rapid Microscopic Spectral Imaging of Lung Cancer Tissue Based on Acousto-Optic Tunable Filter[J]. Chinese Journal of Lasers, 2018, 45(4): 407003 Copy Citation Text show less
    Vectorial diagram of noncollinear acoustic-optic interaction
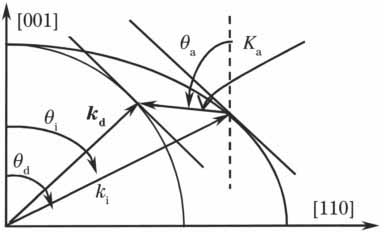
    Fig. 1. Vectorial diagram of noncollinear acoustic-optic interaction
    Experimental setup of the AOTF-based microscopic spectral imaging system
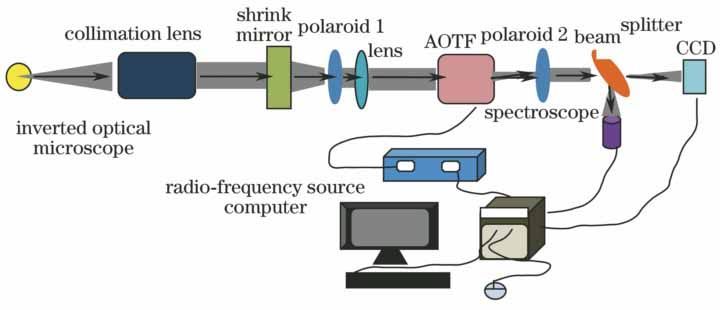
    Fig. 2. Experimental setup of the AOTF-based microscopic spectral imaging system
    Diffraction spectra of AOTF at the different acoustic frequencies. (a) 127 MHz; (b) 134 MHz; (c) 148 MHz; (d) 155 MHz; (e) 162 MHz; (f) 169 MHz
    Fig. 3. Diffraction spectra of AOTF at the different acoustic frequencies. (a) 127 MHz; (b) 134 MHz; (c) 148 MHz; (d) 155 MHz; (e) 162 MHz; (f) 169 MHz
    Performance of AOTF-based microscopic spectral imaging system. (a) Relationship between spectral bandwidth of diffracted beam and central optical wavelength; (b) frequency tuning relation of noncollinear AOTF
    Fig. 4. Performance of AOTF-based microscopic spectral imaging system. (a) Relationship between spectral bandwidth of diffracted beam and central optical wavelength; (b) frequency tuning relation of noncollinear AOTF
    Hyperspectral images of lung cancer tissue with different center wavelengths of diffraction beams. (a) Without filtering; (b) 629.20 nm; (c) 576.21 nm; (d) 567.91 nm; (e) 542.12 nm; (f) 529.45 nm; (g) 503.84 nm; (h) 482.85 nm
    Fig. 5. Hyperspectral images of lung cancer tissue with different center wavelengths of diffraction beams. (a) Without filtering; (b) 629.20 nm; (c) 576.21 nm; (d) 567.91 nm; (e) 542.12 nm; (f) 529.45 nm; (g) 503.84 nm; (h) 482.85 nm
    Relationship between the hyperspectral image intensity of the lung cancer tissue and the diffraction light center wavelength
    Fig. 6. Relationship between the hyperspectral image intensity of the lung cancer tissue and the diffraction light center wavelength
    Intensity difference curves of target area and adjacent tissue
    Fig. 7. Intensity difference curves of target area and adjacent tissue
    ItemDesign parameterand performance
    Acoustic polar angle θa80.0°
    Incident polar angle θi23.80°
    Range of the optical wavelength400-700 nm
    Range of acoustic frequency fa107.5-233.5 MHz
    Driving power1.0-1.5 W
    Designed diffraction efficiency>75% at 632.8 nm
    Incident aperture angle2.85°
    Length of acousto-optic interaction L4.0 mm
    Spectral bandwidth2.9 nm at 632.8 nm
    Table 1. Main design parameters of AOTF
    Acoustic frequency /MHz127134148155162169
    Central optical wavelength /nm601.28576.21534.08516.10499.92485.19
    Spectral bandwidth /nm1.491.220.980.930.830.79
    Spectral resolution R403.54472.30544.98554.94602.31614.16
    Table 2. Parameters of diffraction light spectra under different ultrasonic frequencies
    Yuan Jiangwei, Zhang Chunguang, Wang Hao, Shi Lei. Rapid Microscopic Spectral Imaging of Lung Cancer Tissue Based on Acousto-Optic Tunable Filter[J]. Chinese Journal of Lasers, 2018, 45(4): 407003
    Download Citation