Author Affiliations
1China Transport Telecommunications & Information Center, Beijing 100011, China1中国交通通信信息中心 交通运输遥感中心,北京 1000112China Transport Infocom Technologies Co., Ltd., Beijing 100000, China2北京国交信通科技发展有限公司,北京 1000003School of Geological and Surveying Engineering of Chang'an University, Xi'an 710061, China3长安大学地质工程与测绘学院,西安 7100614School of Geographical Sciences of Guangzhou University, Guangzhou 510006, China4广州大学地理科学学院,广州 510006show less
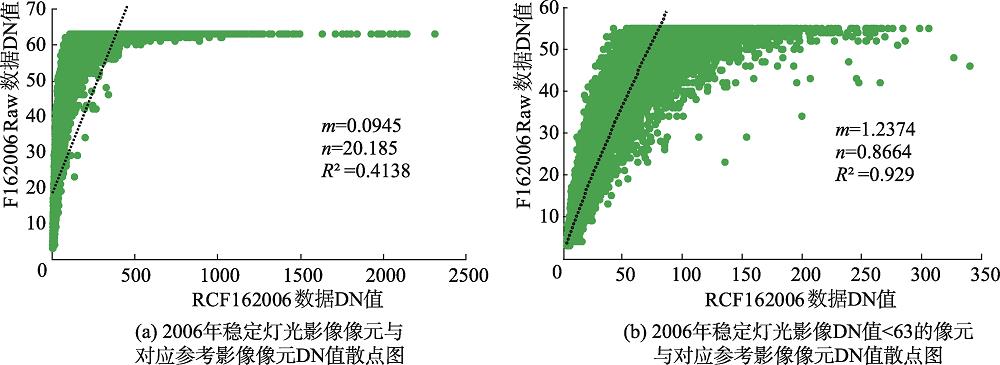
Fig. 1. Comparison of scatter distribution of DNs between SNL images and reference images in 2006
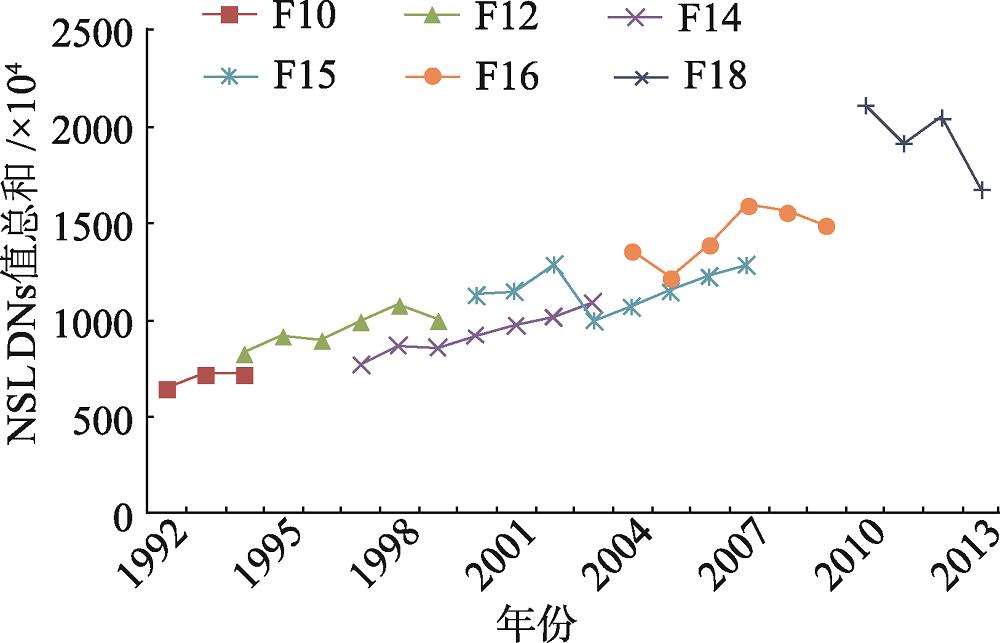
Fig. 2. Sum of the DNs of bright pixels with DN value ≤55 in SNL images obtained from different satellites
Fig. 3. Relationship (and coefficients) of unsaturated pixel DNs between NSL images
Fig. 4. NDLI values of the stable nighttime light image of the same year obtained by different satellites before and after the classified correction
Fig. 5. Sum of bright pixel values obtained from different satellites after correction by different methods
Fig. 6. Comparison of different types of NTL images for some Chinese urban agglomerations in 2006
Fig. 7. Latitudinal transects of different types of NTL index for Jing-Jin-Tang urban agglomerations in 2006
Fig. 8. Correlation of GDP and electricity consumption with 4 types of NTL images for Chinese cities from 1999 to 2013
| 城市 | R2 | 城市 | R2 | 城市 | R2 | 城市 | R2 |
|---|
| 拉萨市 | 0.9673 | 德宏州 | 0.9347 | 宁波市 | 0.9185 | 台州市 | 0.9103 | | 延安市 | 0.9580 | 黄山市 | 0.9335 | 迪庆州 | 0.9178 | 梧州市 | 0.9091 | | 克孜州 | 0.9541 | 甘南州 | 0.9309 | 威海市 | 0.9176 | 苏州市 | 0.9089 | | 凉山州 | 0.9538 | 临沧市 | 0.9300 | 绍兴市 | 0.9171 | 普洱市 | 0.9088 | | 怒江州 | 0.9503 | 遂宁市 | 0.9298 | 重庆市 | 0.9169 | 贺州市 | 0.9080 | | 舟山市 | 0.9469 | 海南州 | 0.9280 | 银川市 | 0.9162 | 南充市 | 0.9078 | | 金华市 | 0.9434 | 杭州市 | 0.9279 | 资阳市 | 0.9157 | 抚州市 | 0.9071 | | 长沙市 | 0.9422 | 和田地区 | 0.9271 | 固原市 | 0.9147 | 上饶市 | 0.9068 | | 喀什地区 | 0.9422 | 保山市 | 0.9261 | 中卫市 | 0.9141 | 西双版纳州 | 0.9068 | | 成都市 | 0.9392 | 博尔塔拉州 | 0.9246 | 铜仁地区 | 0.9124 | 赣州市 | 0.9060 | | 文山州 | 0.9385 | 昌都地区 | 0.9242 | 惠州市 | 0.9119 | 嘉兴市 | 0.9043 | | 石河子市 | 0.9371 | 丽水市 | 0.9220 | 嘉峪关市 | 0.9113 | 河源市 | 0.9017 | | 西宁市 | 0.9349 | 锡林郭勒盟 | 0.9194 | 永州市 | 0.9111 | 桂林市 | 0.9016 | | 甘孜州 | 0.9348 | 丽江市 | 0.9190 | 厦门市 | 0.9109 | 酒泉市 | 0.9010 |
|
Table 1. Chinese cities with the index correlation coefficient between the total DN value of unsaturated pixels in the SNL images and years over 0.9
| 辐射校准的灯光影像 | 混合的稳定灯光影像 | 待校正稳定灯光影像 |
|---|
| F12_1996 | F12_1997 | F10_1992-1994, F12_1994-1999 | | F12_1999 | F14_1999 | F14_1997-2003 | | F12-F15_2000 | F15_2000 | F15_2000-2007 a | | F14-F15_2003 | F15_2003 | | F14_2004 | F15_2004 | | F16_2006 | F16_2006 | F16_2004-2009 | | F16_2010 | F18_2010 | F18_2010-2013 b | | F16_2010-2011 | F18_2010 |
|
Table 2. Representative reference images for raw SNL images
| 稳定灯光影像 | d | e | R2 | 稳定灯光影像 | d | e | R2 |
|---|
| F101992 | 1.6058 | 0.7209 | 0.8261 | F152001 | 1.7151 | 0.6638 | 0.8790 | | F101993 | 1.4223 | 0.7706 | 0.8892 | F152002 | 1.6428 | 0.7099 | 0.8848 | | F101994 | 1.2326 | 0.8284 | 0.8861 | F152003 | 0.9146 | 0.8068 | 0.9204 | | F121994 | 1.5814 | 0.8405 | 0.8629 | F152004 | 0.8386 | 0.8766 | 0.9392 | | F121995 | 1.3788 | 0.8840 | 0.9129 | F152005 | 0.9129 | 0.8569 | 0.9092 | | F121996 | 1.2844 | 0.8915 | 0.9372 | F152006 | 0.9378 | 0.8610 | 0.9028 | | F121997 | 1.2981 | 0.9312 | 0.9462 | F152007 | 1.1294 | 0.8048 | 0.8898 | | F121998 | 1.4016 | 0.9209 | 0.9180 | F162004 | 1.2520 | 0.8496 | 0.9036 | | F121999 | 1.3058 | 0.9414 | 0.8496 | F162005 | 1.1273 | 0.8424 | 0.9204 | | F141997 | 1.2187 | 0.7903 | 0.8974 | F162006 | 1.2374 | 0.8664 | 0.9290 | | F141998 | 1.2622 | 0.7917 | 0.9084 | F162007 | 1.3602 | 0.8881 | 0.9109 | | F141999 | 1.0184 | 0.8740 | 0.9254 | F162008 | 1.3228 | 0.8969 | 0.8708 | | F142000 | 1.1412 | 0.8477 | 0.9055 | F162009 | 1.8805 | 0.7539 | 0.8342 | | F142001 | 1.3947 | 0.8358 | 0.8642 | F182010 | 1.9359 | 0.8480 | 0.8960 | | F142002 | 1.1143 | 0.9249 | 0.8493 | F182011 | 1.3247 | 0.9173 | 0.8207 | | F142003 | 1.1901 | 0.9357 | 0.8088 | F182012 | 1.9522 | 0.8100 | 0.8483 | | F152000 | 1.7378 | 0.6493 | 0.8707 | F182013 | 1.8153 | 0.8430 | 0.7392 |
|
Table 3. Calibration model coefficients for saturated pixels of each stable nighttime light image
| 辐射校准的灯光影像 | C0 | C1 | R2 |
|---|
| F12_1996 | 4.336 | 0.915 | 0.971 | | F12_1999 | 1.423 | 0.780 | 0.980 | | F12-F15_2000 | 3.658 | 0.710 | 0.980 | | F14-F15_2002 | 3.736 | 0.797 | 0.980 | | F14_2004 | 1.062 | 0.761 | 0.984 | | F16_2006 | 0.000 | 1.000 | 1.000 | | F16_2010 | 2.196 | 1.195 | 0.981 | | F16_2010-2011 | -1.987 | 1.246 | 0.981 |
|
Table 4. Coefficients adopted for intercalibration of RC NTL dataset
| 不连续稳定灯光影像 | a | b | c | R2 |
|---|
| F101994 | 0.000 10 | 0.9158 | 0.7429 | 0.9456 | | F121996 | -0.002 40 | 1.1846 | -0.6158 | 0.9481 | | F121999 | -0.000 10 | 0.8944 | 0.8090 | 0.9299 | | F141998 | -0.000 60 | 0.9030 | 0.5025 | 0.9026 | | F162005 | -0.003 50 | 1.1887 | 0.0175 | 0.9198 | | F162006 | -0.005 20 | 1.3614 | -1.1588 | 0.9671 | | F162008 | -0.000 08 | 0.9654 | 0.3562 | 0.9698 | | F162009 | -0.006 60 | 1.3758 | -1.7220 | 0.8883 | | F182010 | -0.000 09 | 0.9353 | -0.4345 | 0.8884 | | F182013 | -0.006 40 | 1.1823 | -0.0691 | 0.8417 |
|
Table 5. Coefficients adopted for intercalibration of unsaturated pixels in discontinuous images