• Chinese Physics B
  • Vol. 29, Issue 9, (2020)
Ya-Lei Huang1、2, Run Yang3, Pei-Gang Li1、4、†, and Hong Xiao2
Author Affiliations
  • 1Department of Physics, Zhejiang Sci-Tech University, Hangzhou 3008, China
  • 2Center for High Pressure Science and Technology Advanced Research, Beijing 100094, China
  • 3Laboratorium für Festkörperphysik, ETH–Zürich, 809, Zürich, Switzerland
  • 4Department of Physics, Beijing University of Posts and Telecommunications, Beijing 100876, China
  • show less
    DOI: 10.1088/1674-1056/ab9f26 Cite this Article
    Ya-Lei Huang, Run Yang, Pei-Gang Li, Hong Xiao. Anisotropy of Ca0.73La0.27(Fe0.96Co0.04)As2 studied by torque magnetometry[J]. Chinese Physics B, 2020, 29(9): Copy Citation Text show less
    (a) Temperature dependent R of Ca0.73La0.27(Fe0.96 Co0.04)As2. (b) Temperature T dependent normalized magnetization data for H = 10 Oe under both zero-field-cooled (ZFC) and field cooled (FC) conditions.
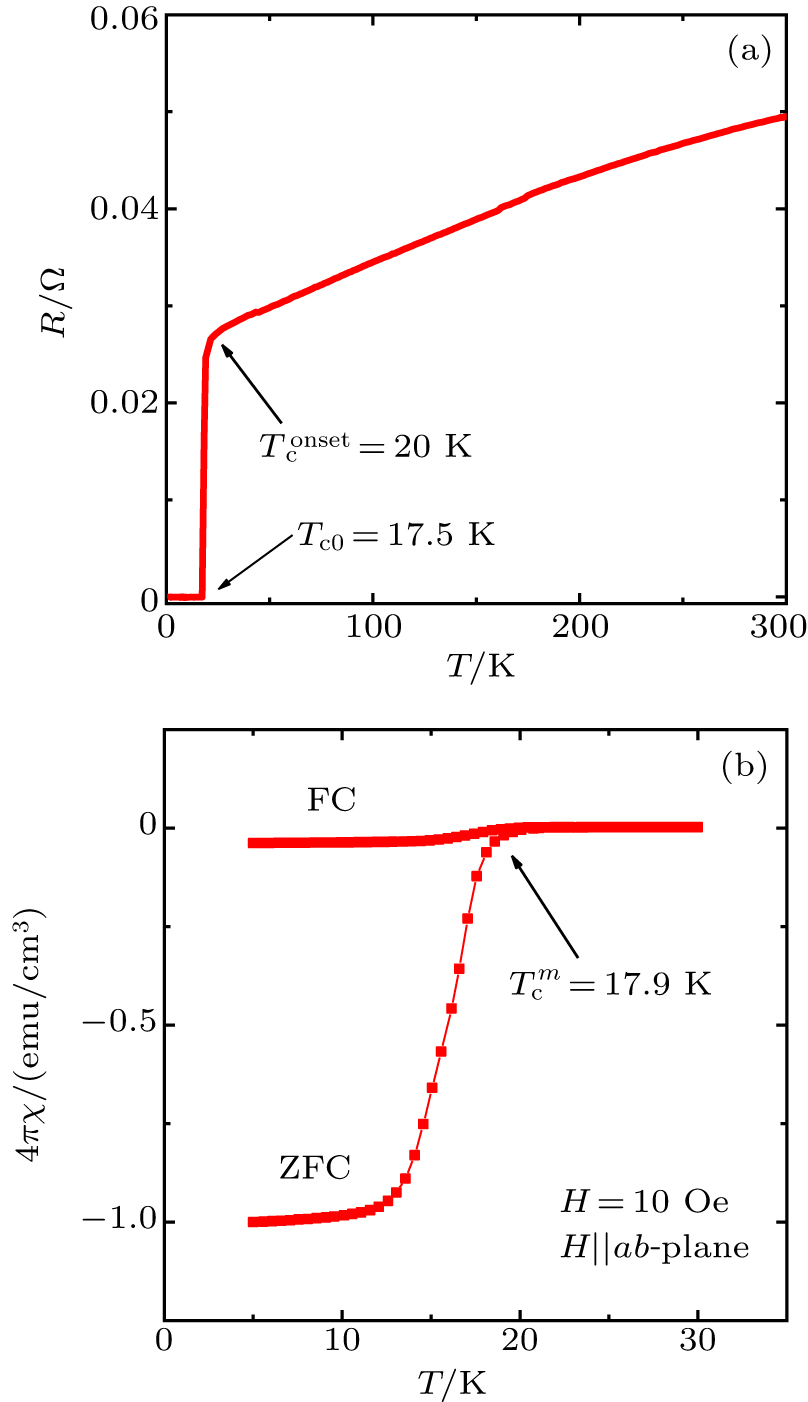
    Fig. 1. (a) Temperature dependent R of Ca0.73La0.27(Fe0.96 Co0.04)As2. (b) Temperature T dependent normalized magnetization data for H = 10 Oe under both zero-field-cooled (ZFC) and field cooled (FC) conditions.
    (a) Typical angular θ dependent torque τ at T = 300 K with a magnetic field H = 5 T, 6 T, 7 T, 8 T, 9 T. The solid lines are fits of the data with τ = τ0 sin2θ. Inset: sketch of the single crystal with the orientation of the magnetic field H with respect to the crystallographic axes. (b) The torque coefficient τ0 vs. H2 at T = 25 K and 300 K. The solid lines are linear fit of the data.
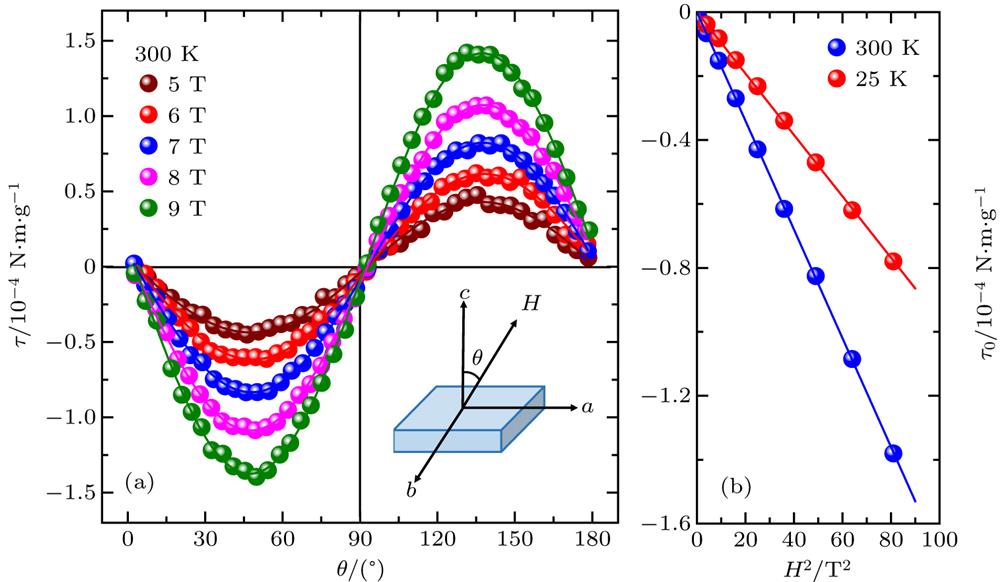
    Fig. 2. (a) Typical angular θ dependent torque τ at T = 300 K with a magnetic field H = 5 T, 6 T, 7 T, 8 T, 9 T. The solid lines are fits of the data with τ = τ0 sin2θ. Inset: sketch of the single crystal with the orientation of the magnetic field H with respect to the crystallographic axes. (b) The torque coefficient τ0 vs. H2 at T = 25 K and 300 K. The solid lines are linear fit of the data.
    (a) Angle θ dependence of the torque τ measured in increasing (green) and decreasing (red) angle at T = 17 K and H = 3 T, and the reversible torque τrev (blue). (b) τrev vs. θ for H = 3 T, 4 T, 5 T, 6 T, 7 T, 8 T, 9 T. The solid lines are fitting curves by Eq. (5). (c) The magnetic field H dependence of anisotropy parameter γ. (d) H dependence of the fitting parameter β. The solid line is a guide to the eyes.
    Fig. 3. (a) Angle θ dependence of the torque τ measured in increasing (green) and decreasing (red) angle at T = 17 K and H = 3 T, and the reversible torque τrev (blue). (b) τrev vs. θ for H = 3 T, 4 T, 5 T, 6 T, 7 T, 8 T, 9 T. The solid lines are fitting curves by Eq. (5). (c) The magnetic field H dependence of anisotropy parameter γ. (d) H dependence of the fitting parameter β. The solid line is a guide to the eyes.
    (a) The reversible part of the torque data τrev for T = 15 K, 16 K, 17 K,18 K with H = 9 T. The solid lines are fitting curves by Eq. (5). (b) The reduced temperature t (T/Tc) dependence of the anisotropy parameter γ. The squares represent data obtained from our torque measurements. The blue triangles represent data of Ca0.82La0.18FeAs2,[11] others symbols represent data for Ca0.8La0.2(Fe0.98Co0.02)As2[12] and Ca0.8La0.2(Fe0.98Co0.02)As2,[30] respectively. The solid line is a guide to the eyes. (c) The reduced temperature t dependence of the in-plane penetration depth λab. (d) The reduced temperature t dependence of the superfluid density ns ∝ λ−2 extracted from the torque data at H = 9 T. The dashed line is a guide to the eyes.
    Fig. 4. (a) The reversible part of the torque data τrev for T = 15 K, 16 K, 17 K,18 K with H = 9 T. The solid lines are fitting curves by Eq. (5). (b) The reduced temperature t (T/Tc) dependence of the anisotropy parameter γ. The squares represent data obtained from our torque measurements. The blue triangles represent data of Ca0.82La0.18FeAs2,[11] others symbols represent data for Ca0.8La0.2(Fe0.98Co0.02)As2[12] and Ca0.8La0.2(Fe0.98Co0.02)As2,[30] respectively. The solid line is a guide to the eyes. (c) The reduced temperature t dependence of the in-plane penetration depth λab. (d) The reduced temperature t dependence of the superfluid density nsλ−2 extracted from the torque data at H = 9 T. The dashed line is a guide to the eyes.
    Ya-Lei Huang, Run Yang, Pei-Gang Li, Hong Xiao. Anisotropy of Ca0.73La0.27(Fe0.96Co0.04)As2 studied by torque magnetometry[J]. Chinese Physics B, 2020, 29(9):
    Download Citation