1Anhui Province Key Laboratory of Measuring Theory and Precision Instrument, School of Instrument Science and Opto-electronic Engineering, Hefei University of Technology, Hefei 230009, China
2Key Laboratory of High Power Laser and Physics, Shanghai Institute of Optics and Fine Mechanics, Chinese Academy of Sciences, Shanghai 201800, China
Jingtao Dong, Tengda Zhang, Lei Yang, Yuzhong Zhang, Rongsheng Lu, Xinglong Xie, "Dark-field line confocal imaging with point confocality and extended line field for bulk defects detection," Chin. Opt. Lett. 21, 041203 (2023)
Copy Citation Text
Fabrication of high-quality optics puts a strong demand on high-throughput detection of macroscopic bulk defects in optical components. A dark-field line confocal imaging method is proposed with two distinct advantages: (i) a point-to-line confocal scheme formed by a columnar elliptical mirror and an optical fiber bundle breaks through the constraint on light collection angle and field of view in the traditional line confocal microscopy using an objective, allowing for an extended confocal line field of more than 100 mm while maintaining a light collection angle of 27°; (ii) the bulk defects are independently illuminated as a function of time to eliminate the cross talk in the direction of the confocal slit, thus preserving point confocality and showing the optical section thicknesses to be 162 µm in the axial direction, and 19 and 22 µm in the orthogonal transverse directions. The experimental results verify that the method has a minimum detectable bulk defect of less than 5 µm and an imaging efficiency of . The method shows great potential in high-throughput and high-sensitivity bulk defects detection.
Three-dimensional (3D) macroscopic defects, referred to as the bulk defects including cracks, pores, or inclusions, are inevitably introduced into an optical component during refinement from its raw state or during fabrication processes. Bulk defect is one of the origins of laser-induced damage when exposed to high-energy irradiation, as it is likely to cause photothermal absorption[1,2], light intensification[3,4], plasma generation[5], and shock-wave propagation[6]. Hence, detection of bulk defects is an indispensable step in fabrication of high-quality optics.
Dark-field confocal imaging has been recognized as an effective tool in bulk defects detection. The point confocality is realized by using a pinhole combined with annular illumination that enables selective acquisition of light scattered from the defect located at the focal point, thus showing a high 3D optical sectioning ability and a high-contrast dark-field image[7,8]. One limitation is that point-by-point scanning to cover a 3D volume is time-consuming. Therefore, expanding the confocal dimension to reduce the scanning freedom has long been a critical challenge in high-throughput detection.
Dark-field line confocal imaging (DF-LCI) alleviates the limitation by using a slit conjugated to line illumination[9]. The scattered light of the defect located only at the line illumination passes through the slit and produces a dark-field image on a line camera via objective and imaging lenses. To further expand the confocal dimension, one way is to distribute multiple slits axially to extend multiple confocal lines at discrete depths[10]. An alternative is to focus the different wavelengths of a broadband line source at different depths to create sequential chromatic confocal lines[11–13]. However, two issues emerge. One is that confocal rejection of the out-of-focus light is effective only in the slit width direction, leading to cross talk in the slit length direction and degradation of the optical sectioning ability[13]. The other is that the inherent constraint on light collection angle and field of view of the objective hinders the simultaneous realization of high collection efficiency of the scattered light and large confocal line field. For instance, a objective with a light collection angle of 24° normally has only 1.2 mm line field.
Sign up for Chinese Optics Letters TOC. Get the latest issue of Chinese Optics Letters delivered right to you!Sign up now
Spectrally encoded line confocal imaging tried to address the issues by using a grating to disperse a broadband source into its component wavelengths in the transverse direction[13–15]. Since the specific transverse position corresponds to the specific wavelength, a spectrometer is used to pick up spectral lines separately to reduce the cross talk. However, the line scan range and the imaging resolution are limited by the source bandwidth, the dispersion power of the grating, and the spectral resolution of the spectrometer. Other challenges include the nonuniformity of the detection sensitivity due to the nonuniform spectrum of the source and a full-field superachromatic design of the objective lens to focus transversely distributed wavelengths in the same focal plane.
We herein present an effective DF-LCI method based on the point-to-line confocal scheme to eliminate both the cross talk and the constraint on light collection angle and field of view, thereby preserving point confocality and showing the potential ability to greatly extend the confocal line field. We apply the method to detect bulk defects of an optical glass to verify its feasibility.
2. Experimental Setup
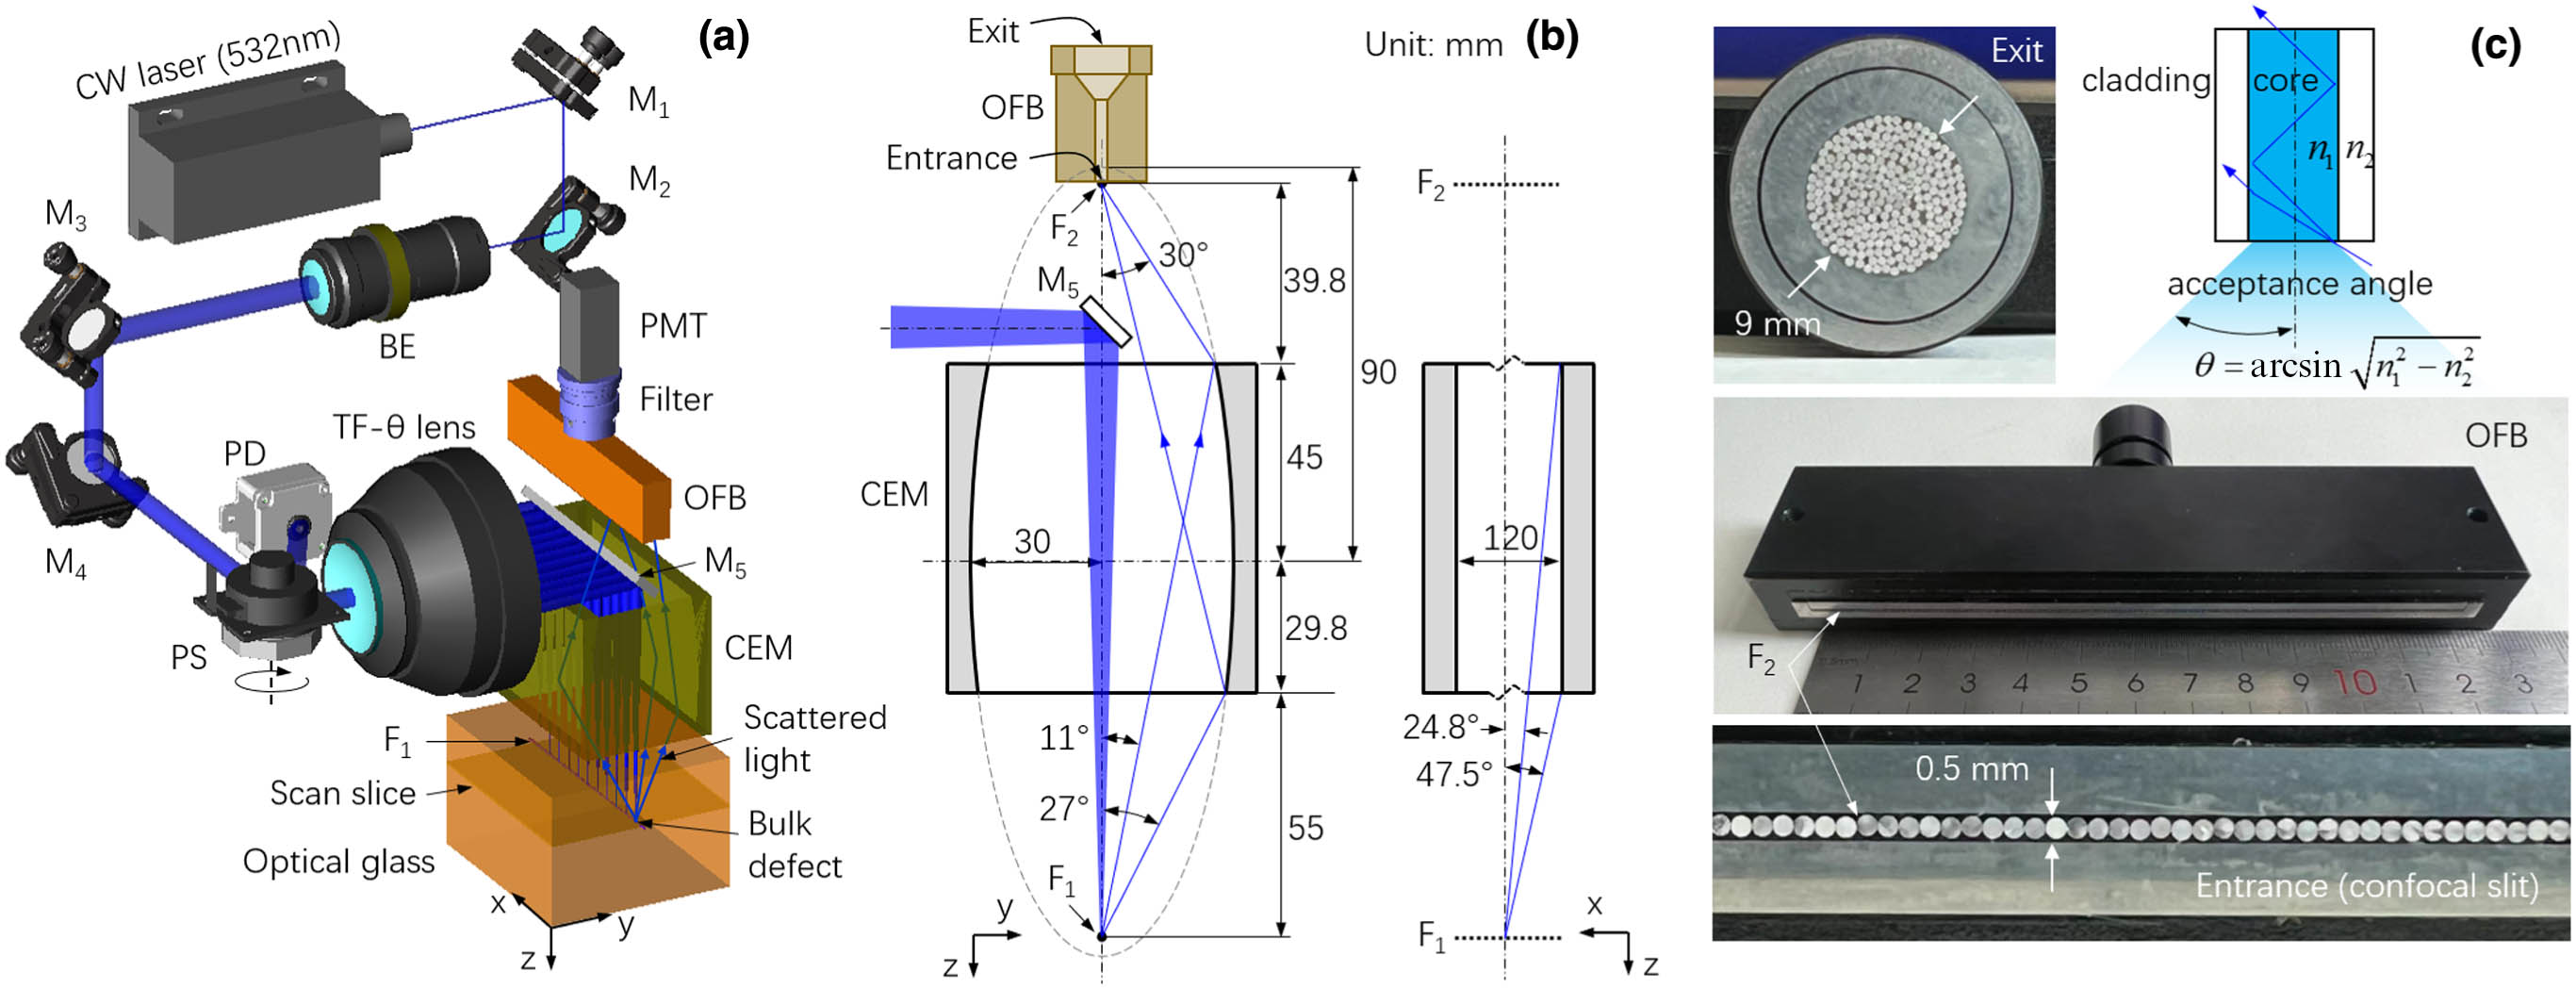
The optical setup of the proposed DF-LCI system is shown in Fig. 1(a). A laser beam (Spectra-Physics, 532 nm, 5 mW, , CW) is directed to a polygon scanner (PS) after being expanded by a beam expander (BE). The PS (Lincoln Laser, rotation frequency stability error , eight faces) scans the beam linearly as a function of time. A telecentric () lens (JCZ Technology, effective focal length of 170 mm, working distance of 214.66 mm, scan area of ) then focuses the incoming beams into a focal line with a length of 120 mm, whose specific position corresponds linearly to the specific time. The telecentric nature of the lens ensures the same incident angle of the line scan beams in the optical glass.
Figure 1.(a) Schematic of the DF-LCI system; (b) principle of scattered light collection; (c) details of the OFB. M, mirror; BE, beam expander; PS, polygon scanner; PD, photodiode; TF-θ lens, telecentric F-θ lens; PMT, photomultiplier tube; OFB, optical fiber bundle; CEM, columnar elliptical mirror.
If a bulk defect in the optical glass is illuminated by the focal line , the light scattered by the bulk defect is collected by a columnar elliptical mirror (CEM) composed of four pieces of fused silica glass with the inner surfaces coated with aluminum film, and then guided by an optical fiber bundle (OFB) to a photomultiplier tube (PMT). Figure 1(b) illustrates the details of the CEM and the OFB for scattered light collection. The inner cross-sectional profile of the CEM in the plane is an ellipse whose focal point coincides exactly with the focal line so that the CEM can collect the light scattered from any position of the focal line and direct it to the other focal line, . The focal line coincides with the entrance of the OFB, which consists of 240 PMMA fibers with a core diameter of 0.5 mm arranged in a linear array and acts as a confocal slit, as shown in Fig. 1(c). The acceptance angle at the entrance of the OFB is given by where and are the refractive index of the core and the cladding, respectively. The acceptance angle of 30° is the constraint for CEM design, which determines the top edge of the CEM. The lower edge of the CEM is limited by the working distance (specified to be 55 mm in this case), resulting in a maximum light collection angle of 27° in the plane. The length of the CEM of 120 mm gives a maximum light collection angle of 47.5° in the plane. Note that the light collection angles can be enlarged by either decreasing the working distance of the CEM or increasing both the short axis of the CEM ellipse and the length of the CEM in the plane to enhance the light collection efficiency. The exit of the OFB is arranged in a circular array with a diameter of 9 mm, so it can be connected to the PMT (Hamamatsu, H10721). A bandpass filter (Thorlabs, FL532-10) is placed before the PMT to block the stray light.
The advantages of the DF-LCI system rely on the scattered light collector composed of the CEM and the OFB. Supposing that the laser beam illuminates bulk defects at two adjacent moments, and , the light scattered by the bulk defects is traced using TracePro software, as shown in Fig. 2. In the side view, scattered light is focused to a spot at the entrance of the OFB due to the elliptical profile of the CEM in the plane. In the front view, the scattered light is reflected and distributed randomly at the entrance of the OFB due to the zero focal power of the CEM in the plane. The entrance of the OFB acting as a confocal slit rejects the out-of-focus light except for the illuminating point, resulting in a point-to-line confocal scheme.
Figure 2.Ray tracing results of the scattered light collector. (a) Stereo view; (b) side view; (c) front view. The blue and red rays correspond to the laser beams illuminating the bulk defects at adjacent moments, t1 and t2, respectively. The scattered light of the bulk defect is assumed to have a Lambertian distribution. For clarity of ray tracing, the blue and red rays corresponding to t1 and t2 are deliberately separated.
The point-to-line confocal scheme presented in Fig. 2 offers two benefits. One is that it breaks through the constraint on light collection angle and field of view by releasing only the object–image conjugation of the CEM in the plane. Therefore, it is possible to greatly extend the confocal line field (i.e., the focal line in Fig. 2) while maintaining a large light collection angle as the length of the CEM, and the OFB in the direction can be easily fabricated to at least 100 mm, which is 2 orders of magnitude larger than the line field of the traditional DF-LCI. This benefit allows for high-throughput bulk defects detection.
The other benefit is that it has no cross talk in the slit length direction, as the bulk defects at the focal line are illuminated independently in spatial position by the laser spot and the corresponding scattered light power is recorded as a function of time, as shown in Fig. 2. In this sense, the lost confocality in the slit length direction can be constrained by the size of the laser spot so that the point confocality can be preserved.
3. Experimental Results
To verify the point confocality of the DF-LCI system, we tested the axial and transverse optical sectioning abilities. It is unnecessary to use fluorescent beads in the submicrometer diameter, as in confocal microscopes, since the DF-LCI system aims to detect macroscopic bulk defects. Instead, we made our own point source using a light-emitting diode (LED) in a surface mount technology (SMT) package covered by a pinhole (Thorlabs, P10HK, µ), as illustrated in the lower right inset in Fig. 3(a).
Figure 3.(a) Illustration of the optical sectioning ability test; lower right inset, the home-made point source with a diameter of 10 µm; upper right inset, transverse optical sectioning ability test with a 5 µm diameter metal fiber scanning across the laser spot; measured OSTs in the (b) z direction; (c) x direction; and (d) y direction for different widths of the confocal slit.
The emitting area of the point source is aligned to the center of the focal line and translated in the direction by a precision stage (Kohzu, ZA05A-W101). The light intensity is recorded by the PMT and plotted as a function of the position in Fig. 3(b). The full width at half-maximum (FWHM) of the light intensity curve shows an axial optical section thickness (OST) of 1.56 mm for the confocal slit (i.e., the entrance of the OFB) width of 0.5 mm. We then placed two knife edges at the entrance of the OFB to narrow the effective confocal slit width down to around 50 µm. The axial OST reduces to 162 µm accordingly. For comparison, the axial OST of the point confocal microscopy is calculated using[16]where is the wavelength, is the refractive index of air, and is the confocal pinhole diameter. Given by µ and (27° is given by the light collection angle of the CEM), the axial OST is 1.558 mm for and 155.8 µm for µ. The result of the comparison verifies that the point-to-line confocal scheme of the DF-LCI system can maintain the axial optical sectioning ability at the same level as the point confocal microscopy.
The transverse OST in the direction is constrained by the laser spot size, as the OBF lacks confocality in the slit length direction. We employed the metal fiber scanning method[17] to estimate the OST. A 5 µm diameter metal fiber is placed at the focal line and scanned in the direction to cut the laser spot, as shown in the upper right inset in Fig. 3(a). The light scattered by the metal fiber is collected by the CEM and the OFB and then detected by the PMT. The light intensity is plotted as a function of the position of the metal fiber, as shown in Fig. 3(c). The transverse OST in the direction given by the FWHM of the light intensity curve is 19 µm and does not vary with the confocal slit width as expected.
The transverse OST in the direction is determined by the minimum between the laser spot size and the confocal slit width. This can be understood by imaging the confocal slit at the focal line via the CEM, which has an elliptical profile with the magnification of . If the laser spot size is larger than the confocal slit width (i.e., the fiber diameter in this work), the confocality depends on the confocal slit width, and vice versa. However, the CEM has no imaging capability in the plane. The confocality is always determined by the beam spot size. Therefore, it is optimal that the beam spot size is smaller than or equal to the confocal slit width such that the confocalities are the same in the orthogonal transverse ( and ) directions. Since the laser spot size is much smaller than the confocal slit width in this case, the transverse OST in the direction is measured to be 22 µm using the metal-fiber scanning method, as shown in Fig. 3(d). Note that the transverse OSTs in the and directions of the point confocal microscopy are mainly determined by the pinhole size, which is usually less than one Airy unit (the diameter of the first minimum of the Airy disk), resulting in the transverse OSTs that are an order of magnitude smaller than that of the proposed DF-LCI system.
The uniformity of the optical sectioning ability is tested as the scattered light is collected at various solid angles along the focal line , as indicated in Fig. 2(c). We first recorded the light intensities using the PMT while translating the point source along the 120 mm long focal line at an interval of 5 mm. The results in Fig. 4(a) show that the relative collection efficiency of the scattered light drops at two ends of the focal line as the solid angle decreases, but it still maintains more than 70% within the 100 mm long focal line, which can be selected as the effective length of the confocal line field.
Figure 4.(a) Uniformity of the scattered light detection. The percentage shows the relative collection efficiency of the scattered light. (b) Uniformity of the axial and transverse optical sectioning abilities.
We then measured the uniformity of the axial OST. At each position (the interval is 5 mm) on the focal line , the scattered light intensity is recorded as a function of the position of the point source. The axial OSTs are obtained by finding the FWHM of each curve of the scattered light intensity. The axial OSTs for all the positions on the focal line are plotted in Fig. 4(b), which shows that the uniformity of the axial OST is independent of the collection efficiency of the scattered light. The average axial OST is 162.6 µm and the peak-to-valley axial OST is only 5.1 µm. Therefore, the uniformity is as high as 96.8%.
The transverse OSTs at different positions of the focal line are measured using the metal-fiber scanning method, as shown in Fig. 4(b). The uniformities in the and directions are 96.2% and 95.9%, respectively.
To verify the feasibility of the DF-LCI system, a rose is fabricated inside a BK7 glass cube () as bulk defects using the laser microengraving technology, as shown in Fig. 5(a). The central region of the focal line is placed inside the glass cube to obtain a good uniformity of the scattered light detection. The PS scans the laser beam in the direction at a rotation frequency of 1364 r/min, and the focal line scans in the direction at 4 mm/s in the meantime, referring to Fig. 1(a). The data acquisition rate of the PMT is set to 1.18 MHz so that the scan interval between two adjacent laser spots is around 22 µm (i.e., the transverse OST). Figure 5(b) shows a dark-field image of a scan slice obtained in the plane. We scanned 80 slices in the direction at a scan interval of 162 µm (i.e., the axial OST) to form an image stack, which is used to reconstruct a 3D point cloud, as shown in Fig. 5(c). The details of the stems and leaves of the rose are clearly detected. The petals show a dense distribution of bulk defects and accurate shape.
Figure 5.(a) Rose fabricated inside a glass cube as the bulk defects using the laser microengraving technology; (b) dark-field image of a scan slice; (c) 3D reconstruction of the rose via the stack of dark-field images; inset, microscopic image of the bulk defects located at the leaves of the rose.
The error of the laser spot location mainly comes from the error of the rotation frequency stability of the PS and the error of the scanning velocity stability of the motorized stage. The former is less than 0.02% given by the vendor, which results in less than pixel error in the dark-field image in accordance with where is the pixels in the extended line field, is the pixel error, is the data acquisition rate, is the ratio of the scan time of the extended line field to the rotation period of one face of the PS, fPM = 1364 r/min is the rotation frequency of the PS, and is the error of the rotation frequency of the PS. The latter is less than µ at the desired velocity of 4 mm/s measured by a laser interferometer (Renishaw, XL-80), which corresponds to less than pixel error.
In the point-by-point scanning dark-field confocal imaging method[7,8], it costs 0.3–0.5 s to scan a slice with an area of , corresponding to an imaging efficiency of at most. In the DF-LCI method[9], the imaging efficiency improves to when a objective with a line field of 1.2 mm is scanned in 4 mm/s. In contrast, the proposed DF-LCI system reaches an imaging efficiency of () due to its extended line field of 100 mm. The imaging efficiency can be further improved by increasing the rotation frequency of the PS along with the scan velocity of the stage (i.e., the temporal resolution). However, a high temporal resolution of the PS results in an extremely short dwell time of the illuminating beam on the bulk defect, leading to fewer scattered photons reaching the PMT and, accordingly, a degraded image quality and resolution. Fortunately, phototoxicity and bleaching is not a problem for bulk defects detection. The scattered photons can be increased by improving the power of the CW laser beam. Therefore, the temporal resolution is preserved without sacrificing the imaging resolution by this means.
The minimum detectable size of the bulk defect is verified using a microscope (ZEISS, Axioscope vario C-DIC, ) to find out the bulk defects as small as possible located at the leaves of the rose and compared with those in the 3D point cloud or the dark-field image stack to determine if they are detected. The inset in the Fig. 5(c) shows the minimum detectable bulk defect can be less than 5 µm, which benefits from the high collection efficiency of the scattered light due to the decoupling of the light collection angle and the field of view.
4. Conclusion
In summary, high-throughput detection of bulk defects in optical components is a critical task in fabrication of high-quality optics. The existing DF-LCI techniques are limited by the problems of (i) inherent constraint between light collection angle and field of view of the objective and (ii) degradation of optical sectioning ability due to the cross talk in the slit length direction. We took a meaningful step toward the task by addressing these problems. On the one hand, the CEM releases only the object–image conjugation in the direction, forming a point-to-line confocal scheme with the assistance of the OFB. This scheme allows for an extended confocal line field more than 100 mm while maintaining a relatively large light collection angle of 27°. On the other hand, the cross talk in the slit length direction is eliminated, as the bulk defects are independently illuminated as a function of time. Thus, the optical sectioning ability is proved to be preserved by comparison of the axial OST with that of point confocal microscopy. The point confocality is verified by measuring the OSTs to be 162 µm ( direction), 19 µm ( direction), and 22 µm ( direction), and the uniformities of the OSTs across the confocal line field are found to be as high as 96%. The results of the experiment on the rose as the bulk defects fabricated inside the glass cube proved that the DF-LCI system improves the imaging efficiency by around 2 orders of magnitude compared with the point-by-point scanning dark-field confocal imaging and the DF-LCI and is sensitive to the bulk defect with the size less than 5 µm, which manifests that the DF-LCI system has great potential in high-throughput and highly sensitive bulk defects detection.
References
[1] J. Huang, H. Liu, F. Wang, X. Ye, L. Sun, X. Zhou, Z. Wu, X. Jiang, W. Zheng, D. Sun. Influence of bulk defects on bulk damage performance of fused silica optics at 355 nm nanosecond pulse laser. Opt. Express, 25, 33416(2017).
[2] Z. Shi, L. Sun, T. Shao, H. Liu, J. Huang, X. Ye, F. Wang, L. Yang, W. Zheng. Statistically correlating laser-induced damage performance with photothermal absorption for fused silica optics in a high-power laser system. Photonics, 9, 137(2022).
[3] M. Nostrand, C. Cerjan, M. Johnson, T. Suratwala, T. Weiland, W. Sell, J. Vickers, R. Luthi, J. Stanley, T. Parham, C. Thorsness. Correlation of laser-induced damage to phase objects in bulk fused silica. Proc. SPIE, 5647, 233(2005).
[4] C. L. Zhang, C. M. Yao, C. D. Wang. Laser intensification induced by air bubbles below nonideal repaired damage site. Optik, 127, 3105(2016).
[5] J. Yu, X. Xiang, S. He, X. Yuan, W. Zheng, H. Lü, X. Zu. Laser-induced damage initiation and growth of optical materials. Adv. Condens. Matter Phys., 2014, 364627(2014).
[6] F. Geng, M. Liu, Q. Zhang, Z. Liu, Q. Xu, Y. Li. Ultraviolet nanosecond laser-induced damage on potassium dihydrogen phosphate crystal surface originated from different defects. Opt. Eng., 60, 031003(2020).
[7] J. Liu, J. Liu, C. Liu, Y. Wang. 3D dark-field confocal microscopy for subsurface defects detection. Opt. Lett., 45, 660(2020).
[8] J. Liu, Z. Hua, C. Liu. Compact dark-field confocal microscopy based on an annular beam with orbital angular momentum. Opt. Lett., 46, 5591(2021).
[9] D. Wang, Y. Chen, Y. Wang, J. T. C. Liu. Comparison of line-scanned and point-scanned dual-axis confocal microscope performance. Opt. Lett., 38, 5280(2013).
[10] J. M. Tsang, H. J. Gritton, S. L. Das, T. D. Weber, C. S. Chen, X. Han, J. Mertz. Fast, multiplane line-scan confocal microscopy using axially distributed slits. Biomed. Opt. Express, 12, 1339(2021).
[11] J. Seppä, K. Niemelä, A. Lassila. Metrological characterization methods for confocal chromatic line sensors and optical topography sensors. Meas. Sci. Technol., 29, 054008(2018).
[12] H. Hu, S. Mei, L. Fan, H. Wang. A line-scanning chromatic confocal sensor for three-dimensional profile measurement on highly reflective materials. Rev. Sci. Instrum., 92, 053707(2021).
[13] C. S. Kim, H. Yoo. Three-dimensional confocal reflectance microscopy for surface metrology. Meas. Sci. Technol., 32, 102002(2021).
[14] J. Hwang, S. Kim, J. Heo, D. Lee, S. Ryu, C. Joo. Frequency-and spectrally-encoded confocal microscopy. Opt. Express, 23, 5809(2015).
[15] K. Soocheol, H. Jaehyun, H. Jung, R. Su-Ho, L. Donghak, K. Sang-Hoon, O. Seung Jae, J. Chulmin. Spectrally encoded slit confocal microscopy using a wavelength-swept laser. J. Biomed. Opt., 20, 036016(2015).
[17] M. Mylonakis, S. Pandey, K. G. Mavrakis, G. Drougakis, G. Vasilakis, D. G. Papazoglou, W. von Klitzing. Simple precision measurements of optical beam sizes. Appl. Opt., 57, 9863(2018).
Jingtao Dong, Tengda Zhang, Lei Yang, Yuzhong Zhang, Rongsheng Lu, Xinglong Xie, "Dark-field line confocal imaging with point confocality and extended line field for bulk defects detection," Chin. Opt. Lett. 21, 041203 (2023)