• Photonics Research
  • Vol. 7, Issue 8, 939 (2019)
Cheng Li1, Lei Chen1、2, Euan McLeod1, and Judith Su1、3、*
Author Affiliations
  • 1College of Optical Sciences, University of Arizona, Tucson, Arizona 85721, USA
  • 2State Key Laboratory of Information Photonics and Optical Communications, Beijing University of Posts and Telecommunications, Beijing 100876, China
  • 3Department of Biomedical Engineering, University of Arizona, Tucson, Arizona 85721, USA
  • show less
    DOI: 10.1364/PRJ.7.000939 Cite this Article Set citation alerts
    Cheng Li, Lei Chen, Euan McLeod, Judith Su. Dark mode plasmonic optical microcavity biochemical sensor[J]. Photonics Research, 2019, 7(8): 939 Copy Citation Text show less
    Schematic of a microtoroid cavity. (a) The E-field is normalized by the amplitude of the maximum field in the evanescent zone of the bare WGM toroid [Eo(r)]. (b) A rendering of a gold nanorod placed parallel to the TE polarization of the WGM cavity mode. The resonance frequency of a single rod is tuned by adjusting its aspect ratio, which is defined as the ratio of the length to the width (diameter) of the rod. (c) Field distribution of the excited dipole mode around a nanorod.
    Fig. 1. Schematic of a microtoroid cavity. (a) The E-field is normalized by the amplitude of the maximum field in the evanescent zone of the bare WGM toroid [Eo(r)]. (b) A rendering of a gold nanorod placed parallel to the TE polarization of the WGM cavity mode. The resonance frequency of a single rod is tuned by adjusting its aspect ratio, which is defined as the ratio of the length to the width (diameter) of the rod. (c) Field distribution of the excited dipole mode around a nanorod.
    (a) Blue shift or red shift of the cavity mode around on-resonance coupling. (b) The relationship between the linewidth corresponding to system loss and the resonance of a single rod. (c) Q factor and enhancement factor as functions of the resonance for a single nanorod. The trend for the enhancement factor is similar to the linewidth change in (b). Extremely strong enhancements are shown for on-resonance coupling. Due to the light–matter interaction, a very strong hot spot is generated between the plasmonic nanorod and the biomolecule. (d) The relationship between the combined enhancement factor (fC) and the resonance frequency of the rod.
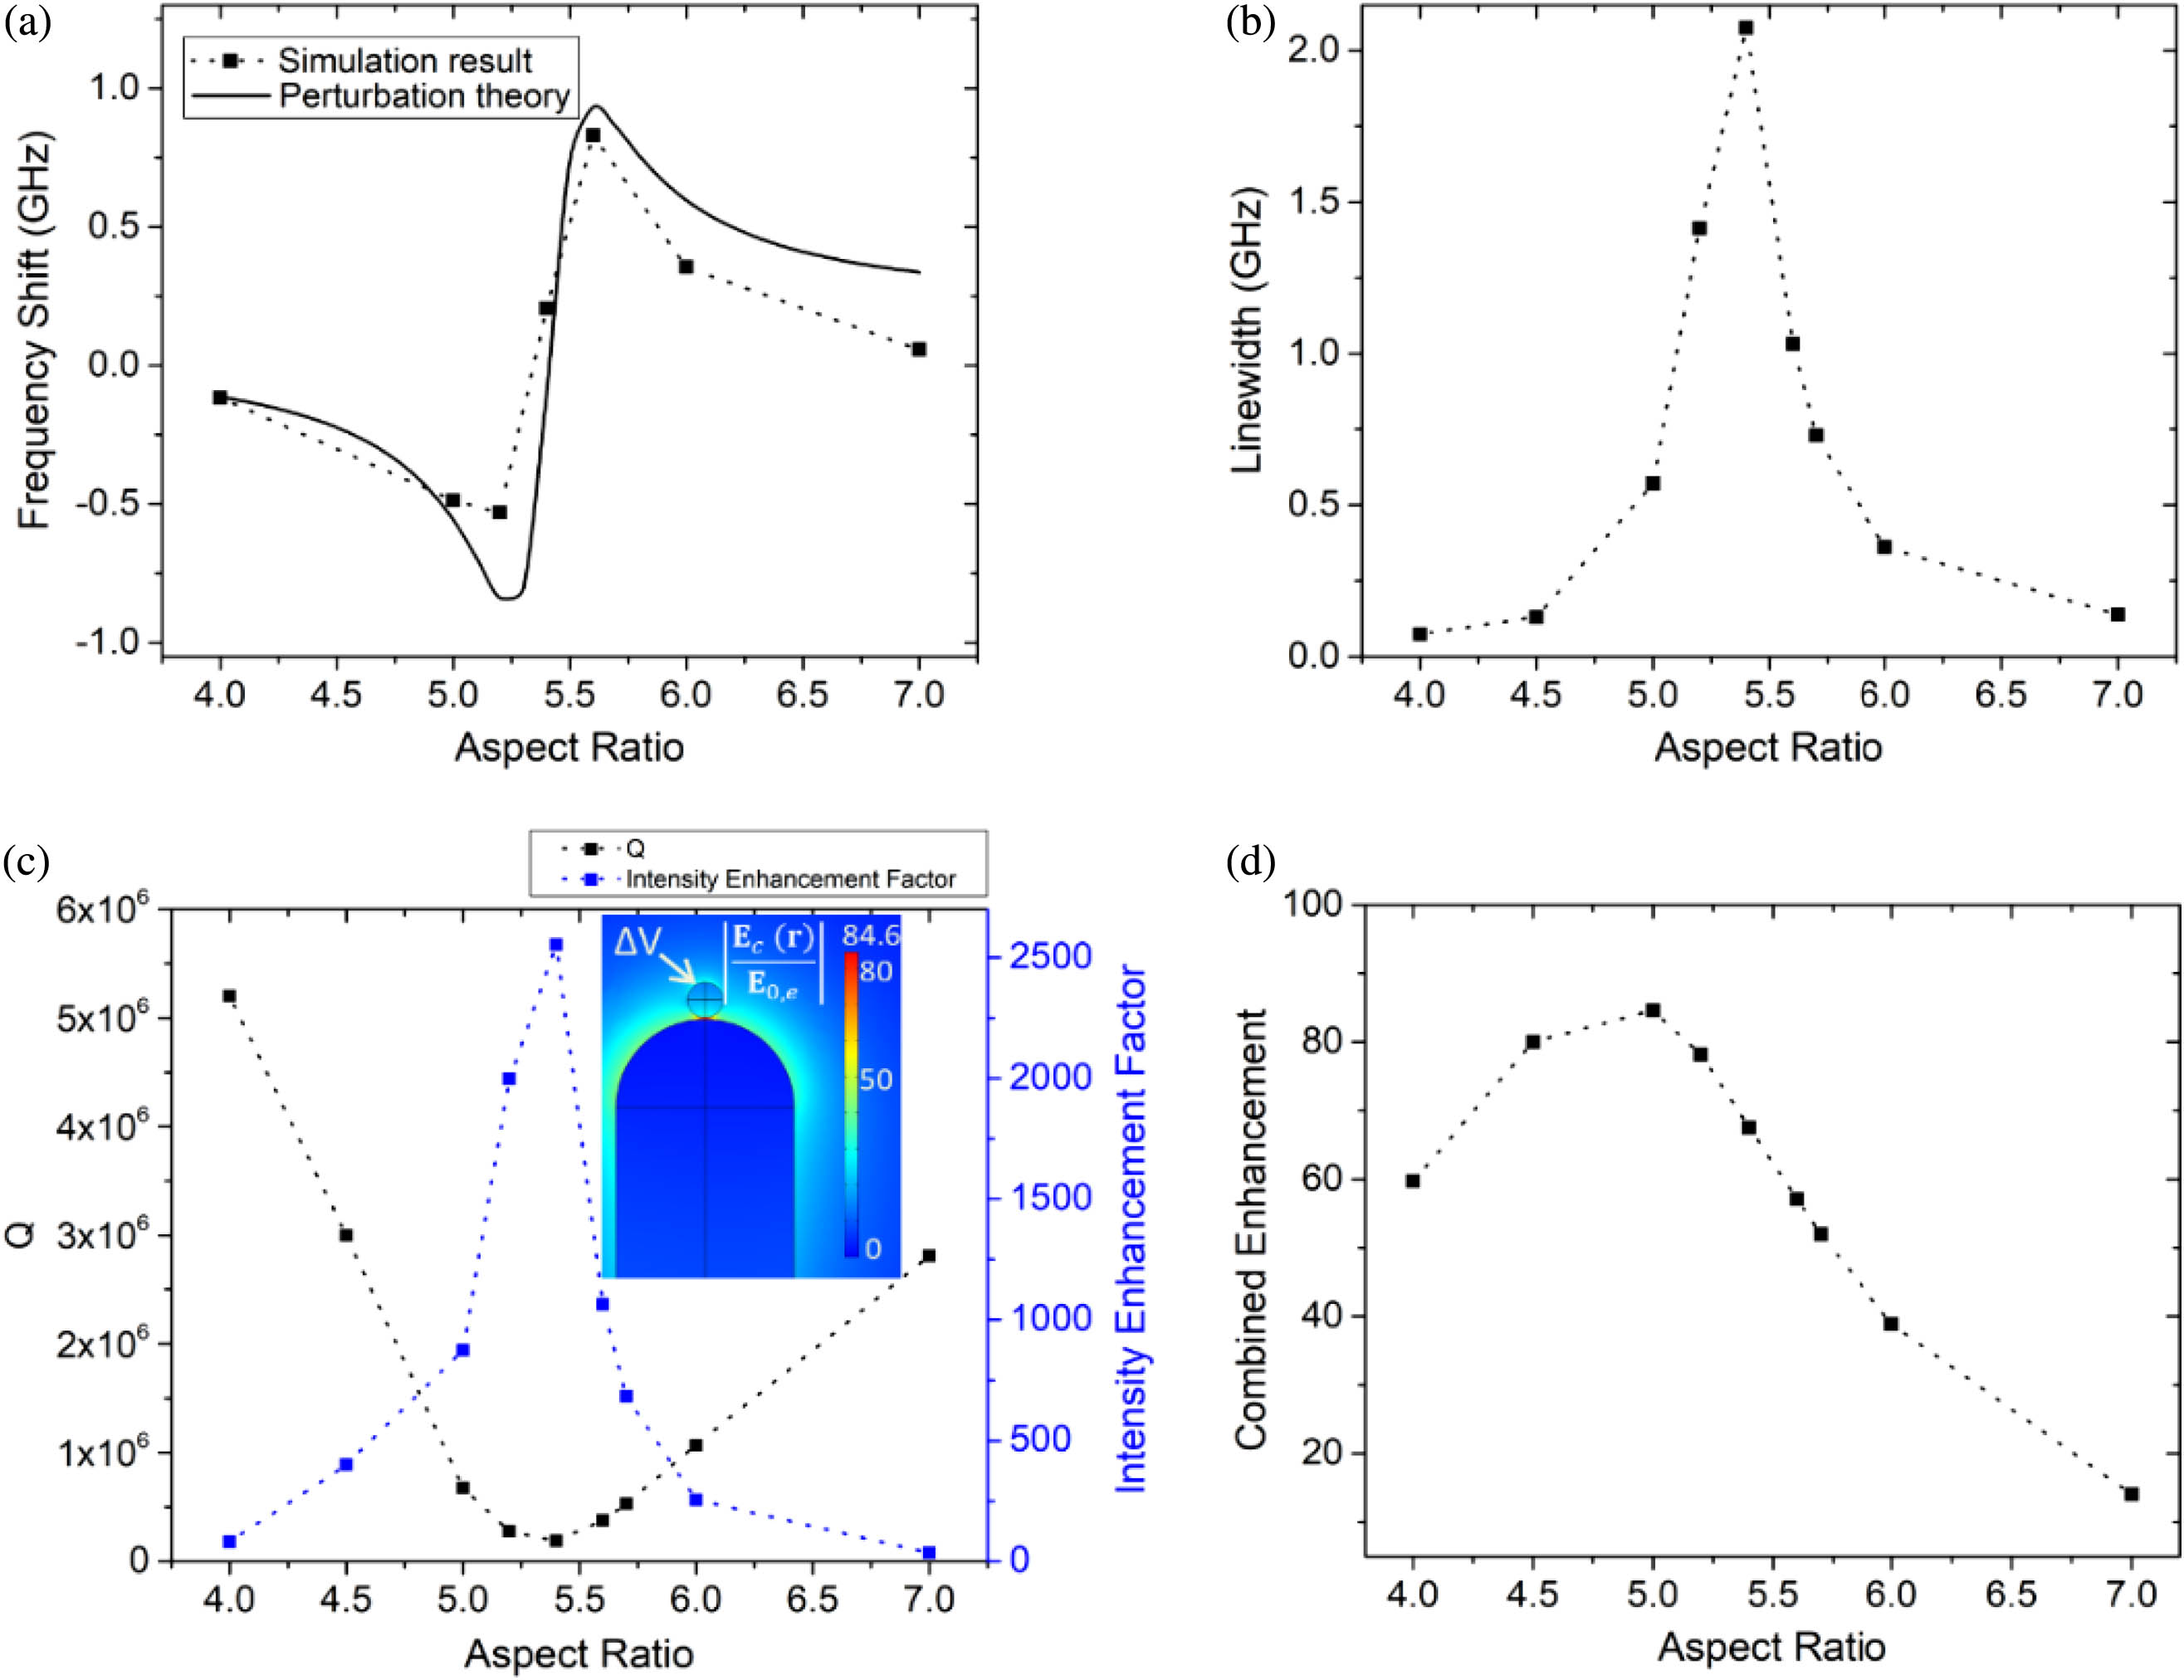
    Fig. 2. (a) Blue shift or red shift of the cavity mode around on-resonance coupling. (b) The relationship between the linewidth corresponding to system loss and the resonance of a single rod. (c) Q factor and enhancement factor as functions of the resonance for a single nanorod. The trend for the enhancement factor is similar to the linewidth change in (b). Extremely strong enhancements are shown for on-resonance coupling. Due to the light–matter interaction, a very strong hot spot is generated between the plasmonic nanorod and the biomolecule. (d) The relationship between the combined enhancement factor (fC) and the resonance frequency of the rod.
    (a) Q factors obtained through both numerical simulations and coupled mode theory are consistent for the systems involving multiple nanorods and no direct inter-rod coupling. (b) Top view of multiple rods coupled to the cavity mode. (b) and Fig. 2(c) share the same color bar.
    Fig. 3. (a) Q factors obtained through both numerical simulations and coupled mode theory are consistent for the systems involving multiple nanorods and no direct inter-rod coupling. (b) Top view of multiple rods coupled to the cavity mode. (b) and Fig. 2(c) share the same color bar.
    (a) Plane wave excitation for three isolated rods and a gold trimer. (b) Spectral comparison of the total extinction cross section of the lateral dark mode versus the three isolated rods from (a). The lateral dark mode is excited at the peak wavelength of the red curve. The illustrations show the charge distribution of the breathing and lateral dark modes at different wavelengths. Because the coupling between the breathing dark mode and free-space radiation is so small, no peak is visible at its resonance around 725 nm. (c) Quality and intensity enhancement factors as functions of the aspect ratios of each individual rod. The red arrows show the current density direction obtained in COMSOL. The inset shows the field distribution of the excited lateral dark mode. The characteristic dark spot between the ends of the bottom two rods is clearly visible. (d) Plot of the fC of the trimer. The lateral dark mode exhibits a higher combined enhancement value than that obtained from the coupling of a single rod to the cavity alone.
    Fig. 4. (a) Plane wave excitation for three isolated rods and a gold trimer. (b) Spectral comparison of the total extinction cross section of the lateral dark mode versus the three isolated rods from (a). The lateral dark mode is excited at the peak wavelength of the red curve. The illustrations show the charge distribution of the breathing and lateral dark modes at different wavelengths. Because the coupling between the breathing dark mode and free-space radiation is so small, no peak is visible at its resonance around 725 nm. (c) Quality and intensity enhancement factors as functions of the aspect ratios of each individual rod. The red arrows show the current density direction obtained in COMSOL. The inset shows the field distribution of the excited lateral dark mode. The characteristic dark spot between the ends of the bottom two rods is clearly visible. (d) Plot of the fC of the trimer. The lateral dark mode exhibits a higher combined enhancement value than that obtained from the coupling of a single rod to the cavity alone.
    Influence of different perturbations on the trimer’s combined enhancement factor. (a) and (b) Small changes in angle and length can maintain the fC. (c) To ensure that the gap space is large enough for particles to bind, we study the effect of the spacing on the system when the spacing is greater than 5 nm. The illustrations for the trimer field distribution use the same color bar as in Fig. 3. (d) The fC of a single rod system decreases with increasing rotation angle. When the rod is rotated 90 deg, that is, perpendicular to the polarization of the TE mode, the overall system improvement fC is only 4. The white area in the inset shows where the magnitude of the E-field is 10× greater than that of a bare cavity. (e) The rotation of the trimer has little effect on fC. The white area in the inset shows where the magnitude of the E-field is 10× greater than that of a bare cavity. The enhancement area provided by the trimer in (e) is slightly more than twice that of a single rod in (d).
    Fig. 5. Influence of different perturbations on the trimer’s combined enhancement factor. (a) and (b) Small changes in angle and length can maintain the fC. (c) To ensure that the gap space is large enough for particles to bind, we study the effect of the spacing on the system when the spacing is greater than 5 nm. The illustrations for the trimer field distribution use the same color bar as in Fig. 3. (d) The fC of a single rod system decreases with increasing rotation angle. When the rod is rotated 90 deg, that is, perpendicular to the polarization of the TE mode, the overall system improvement fC is only 4. The white area in the inset shows where the magnitude of the E-field is 10× greater than that of a bare cavity. (e) The rotation of the trimer has little effect on fC. The white area in the inset shows where the magnitude of the E-field is 10× greater than that of a bare cavity. The enhancement area provided by the trimer in (e) is slightly more than twice that of a single rod in (d).
    (a) Schematic of the wedge model. (b) E-field distribution of a particle coupled to a toroid cavity (top view). The particle is placed at the antinode. (c) A zoom-in of near-field enhancement. (d) and (e) show the SM and ASM of the coupled system obtained by the whole 3D model using the eigenfrequency solver, respectively. The corresponding detuning frequency between the SM and ASM modes is 200 MHz.
    Fig. 6. (a) Schematic of the wedge model. (b) E-field distribution of a particle coupled to a toroid cavity (top view). The particle is placed at the antinode. (c) A zoom-in of near-field enhancement. (d) and (e) show the SM and ASM of the coupled system obtained by the whole 3D model using the eigenfrequency solver, respectively. The corresponding detuning frequency between the SM and ASM modes is 200 MHz.
    Cheng Li, Lei Chen, Euan McLeod, Judith Su. Dark mode plasmonic optical microcavity biochemical sensor[J]. Photonics Research, 2019, 7(8): 939
    Download Citation