• High Power Laser Science and Engineering
  • Vol. 9, Issue 4, 04000e53 (2021)
E. L. Clark1, A. Grigoriadis1、2, S. Petrakis1、2, I. Tazes1、3, G. Andrianaki1、4, A. Skoulakis1, Y. Orphanos1、5, E. Kaselouris1, I. Fitilis1、3, J. Chatzakis1、3, E. Bakarezos1、5, V. Dimitriou1、5, E. P. Benis1、2, N. A. Papadogiannis1、5, and M. Tatarakis1、3、*
Author Affiliations
  • 1Institute of Plasma Physics and Lasers, Hellenic Mediterranean University Research Centre, 74100Rethymno, Greece
  • 2Department of Physics, University of Ioannina, 45110Ioannina, Greece
  • 3Department of Electronic Engineering, Hellenic Mediterranean University, 73133Chania, Greece
  • 4School of Production Engineering and Management, Technical University of Crete, 73100Chania, Greece
  • 5Department of Music Technology and Acoustics, Hellenic Mediterranean University, 74133Rethymno, Greece
  • show less
    DOI: 10.1017/hpl.2021.38 Cite this Article Set citation alerts
    E. L. Clark, A. Grigoriadis, S. Petrakis, I. Tazes, G. Andrianaki, A. Skoulakis, Y. Orphanos, E. Kaselouris, I. Fitilis, J. Chatzakis, E. Bakarezos, V. Dimitriou, E. P. Benis, N. A. Papadogiannis, M. Tatarakis. High-intensity laser-driven secondary radiation sources using the ZEUS 45 TW laser system at the Institute of Plasma Physics and Lasers of the Hellenic Mediterranean University Research Centre[J]. High Power Laser Science and Engineering, 2021, 9(4): 04000e53 Copy Citation Text show less
    A 3D schematic layout of the ZEUS 45 TW laser system.
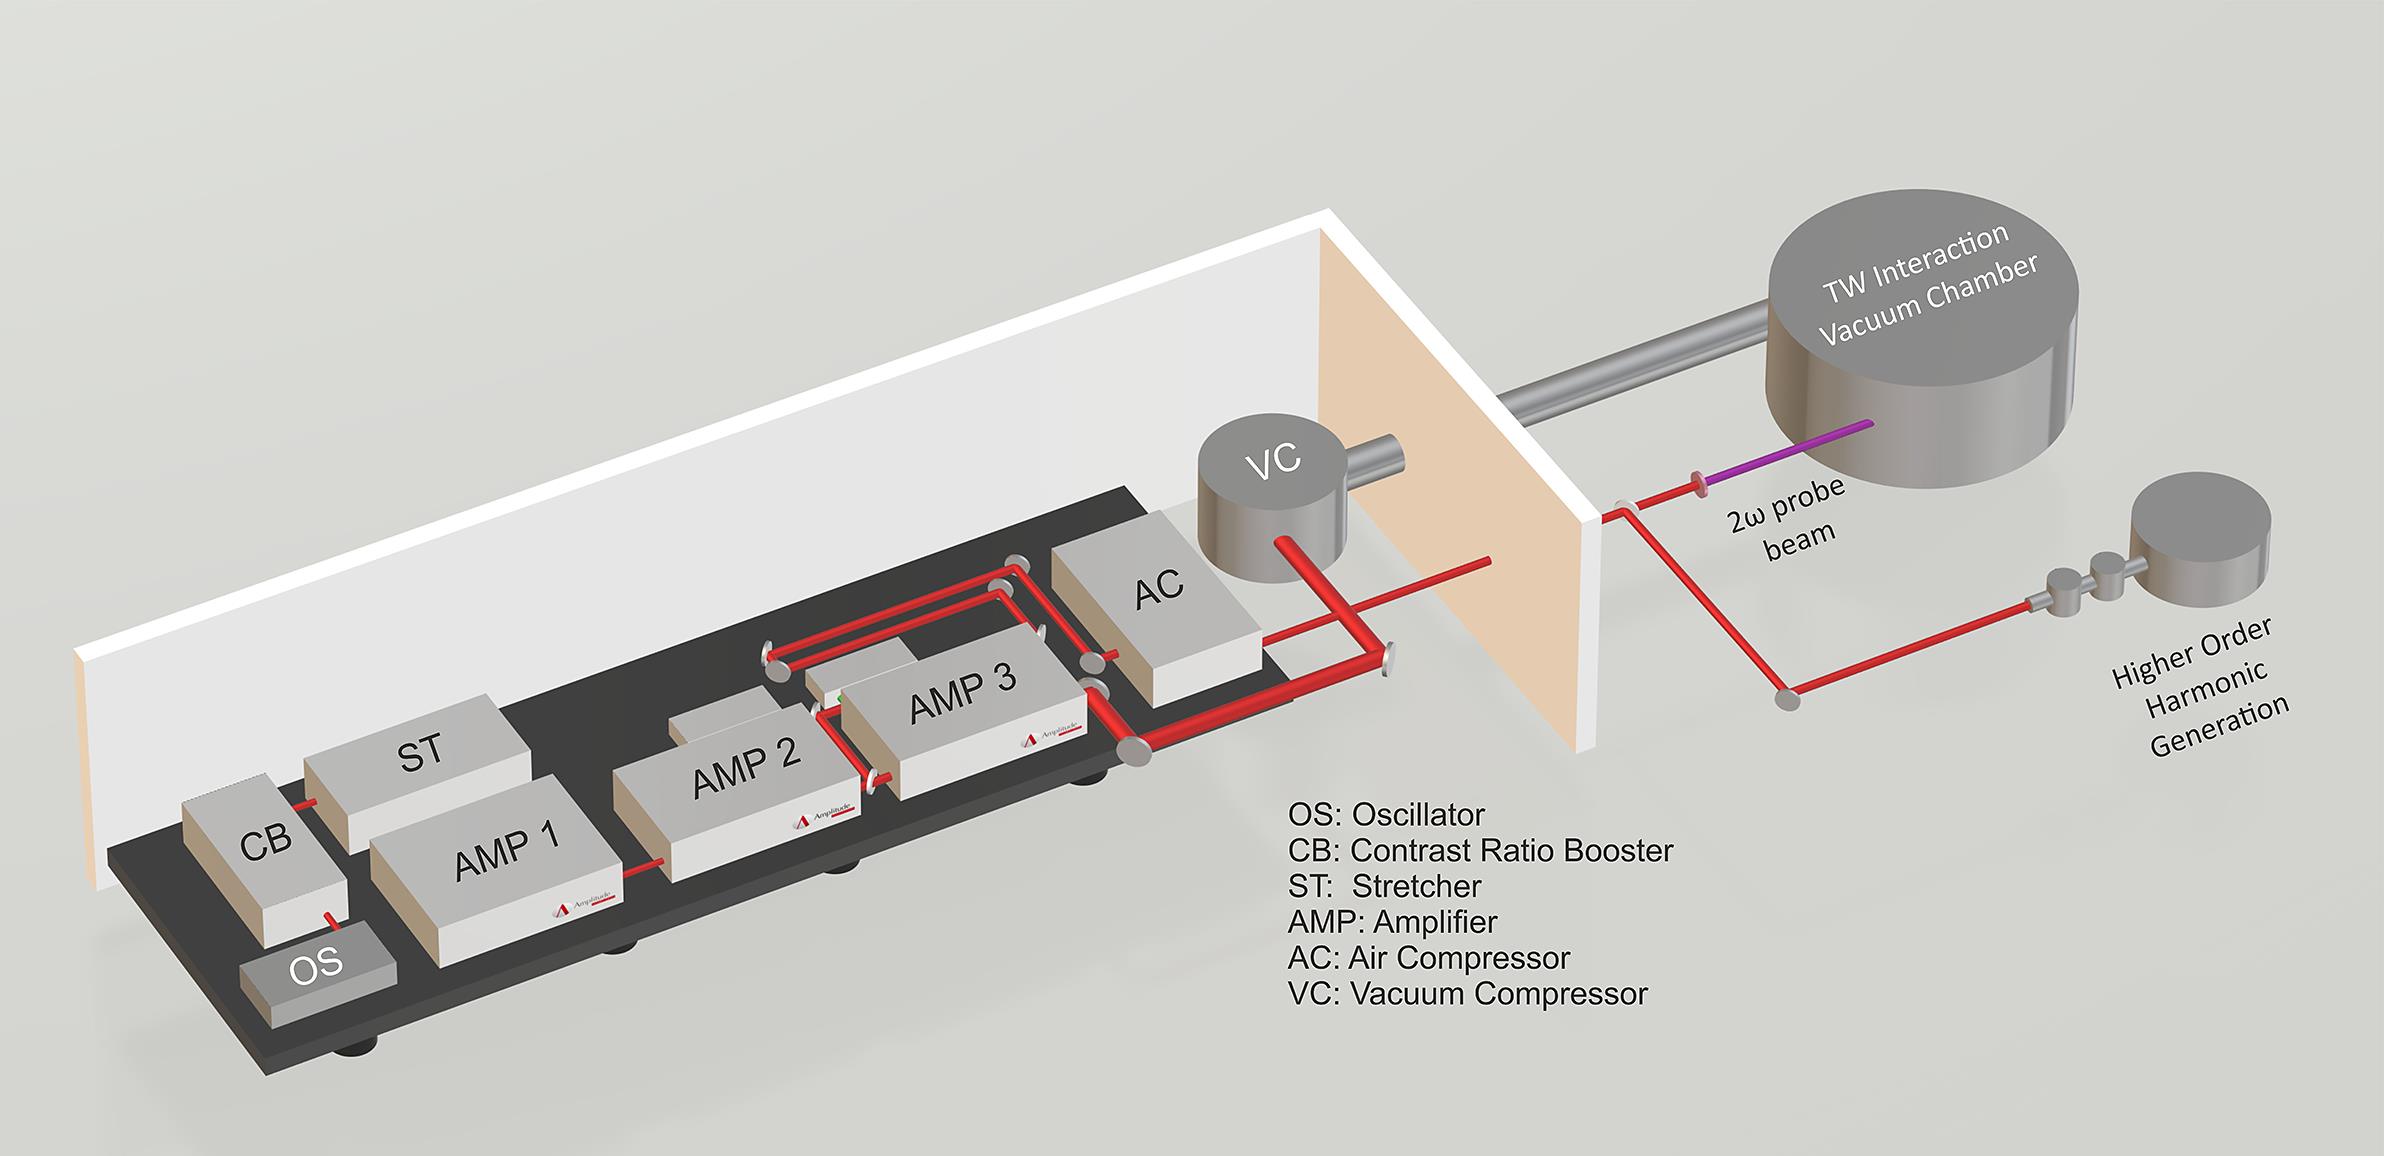
    Fig. 1. A 3D schematic layout of the ZEUS 45 TW laser system.
    The contrast of the ZEUS laser system as measured by the SEQUOIA third-order autocorrelator.
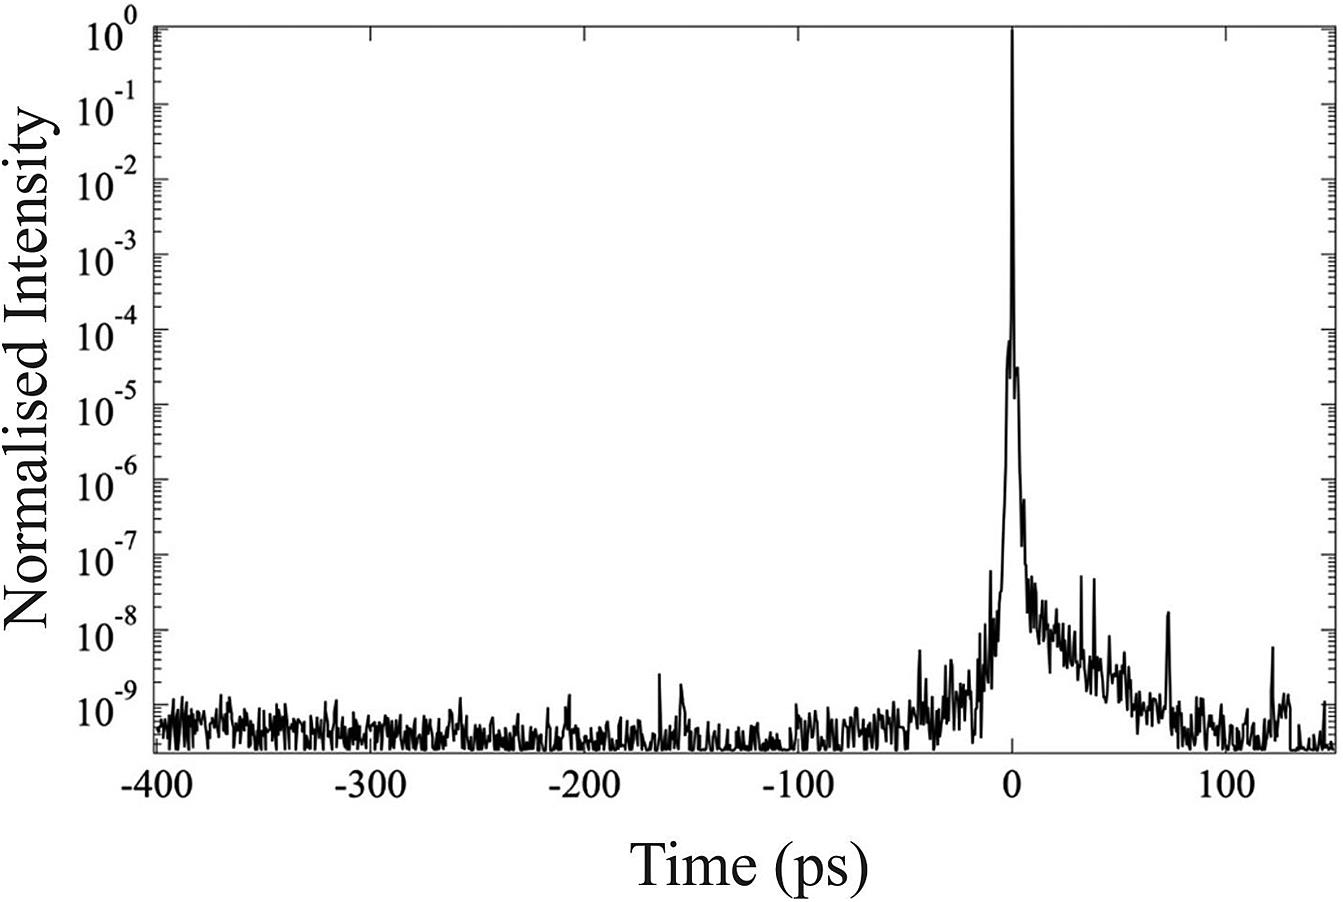
    Fig. 2. The contrast of the ZEUS laser system as measured by the SEQUOIA third-order autocorrelator.
    A drawing of the ZEUS target interaction chamber for ion-acceleration experiments. Also shown is a typical image of the laser pulse focused with the f/2 focal length parabola.
    Fig. 3. A drawing of the ZEUS target interaction chamber for ion-acceleration experiments. Also shown is a typical image of the laser pulse focused with the f/2 focal length parabola.
    A shadowgram captured 650 ps before the arrival of the main pulse. The laser is incident from the left to the right onto a 30 μm thick solid aluminium target.
    Fig. 4. A shadowgram captured 650 ps before the arrival of the main pulse. The laser is incident from the left to the right onto a 30 μm thick solid aluminium target.
    The scanned irradiated radiochromic films (RCFs), accompanied by the calibrated (bottom) RCFs indicating a falloff in optical density and therefore dose as the electron energy increases. The energies indicated are a guide to the minimum electron energy required to penetrate through to a particular layer. The accumulated dose corresponds to eight laser shots.
    Fig. 5. The scanned irradiated radiochromic films (RCFs), accompanied by the calibrated (bottom) RCFs indicating a falloff in optical density and therefore dose as the electron energy increases. The energies indicated are a guide to the minimum electron energy required to penetrate through to a particular layer. The accumulated dose corresponds to eight laser shots.
    Electron spectrum as recorded in the central region of the radiochromic film.
    Fig. 6. Electron spectrum as recorded in the central region of the radiochromic film.
    Electron dose profile and iso-dose lines of the radiochromic films (EBT3) irradiated by 20 shots inside the re-entrant tube (left). On the right, a line out of the dose as a function of distance is shown.
    Fig. 7. Electron dose profile and iso-dose lines of the radiochromic films (EBT3) irradiated by 20 shots inside the re-entrant tube (left). On the right, a line out of the dose as a function of distance is shown.
    A series of scanned images of a filtered CR39. (a) Protons produced by the irradiation of 70 μm thick Al target with the 25 fs laser pulse. (b) Protons produced by the irradiation of 30 μm thick Al target with the 80 fs laser pulse. (c) Protons produced by the irradiation of 30 μm thick Al target with the 150 fs laser pulse. (d) Schematic representation indicating the thickness of the Al foil filtering on each sector of the diagnostic. The maximum proton energy producing and generating a crater on the surface of the CR39 nuclear track detector is in the range of 1.5–2.3 MeV which corresponds to image (b). Higher proton energies if they existed would have appeared on the 52 μm and the other Al filtered sectors which lack signal for all cases examined.
    Fig. 8. A series of scanned images of a filtered CR39. (a) Protons produced by the irradiation of 70 μm thick Al target with the 25 fs laser pulse. (b) Protons produced by the irradiation of 30 μm thick Al target with the 80 fs laser pulse. (c) Protons produced by the irradiation of 30 μm thick Al target with the 150 fs laser pulse. (d) Schematic representation indicating the thickness of the Al foil filtering on each sector of the diagnostic. The maximum proton energy producing and generating a crater on the surface of the CR39 nuclear track detector is in the range of 1.5–2.3 MeV which corresponds to image (b). Higher proton energies if they existed would have appeared on the 52 μm and the other Al filtered sectors which lack signal for all cases examined.
    A drawing of the ZEUS target interaction chamber configured for a long focal length parabola for electron acceleration in a laser wakefield scheme.
    Fig. 9. A drawing of the ZEUS target interaction chamber configured for a long focal length parabola for electron acceleration in a laser wakefield scheme.
    Relativistic electron spectral images as recorded by a CCD camera that is imaging the Lanex screen.
    Fig. 10. Relativistic electron spectral images as recorded by a CCD camera that is imaging the Lanex screen.
    Typical quasi-monοenergetic electron spectra produced in the laser wakefield interaction and at the corresponding total charge.
    Fig. 11. Typical quasi-monοenergetic electron spectra produced in the laser wakefield interaction and at the corresponding total charge.
    The betatron-type X-ray source setup. (1) Off-axis parabolic mirror with 1 m focal length (f/13). (2) Pulsed-jet gas target. (3) Magnetic spectrometer. (4) Scintillating screen. (5) CCD camera. (6) 10 μm thick Al foil. (7) X-ray CCD camera. The plasma waves and the plasma bubble formed by the interaction of the laser pulses with the gas targets are depicted in the inset. The generated X-rays and relativistic electrons are recorded simultaneously on a shot-to-shot basis.
    Fig. 12. The betatron-type X-ray source setup. (1) Off-axis parabolic mirror with 1 m focal length (f/13). (2) Pulsed-jet gas target. (3) Magnetic spectrometer. (4) Scintillating screen. (5) CCD camera. (6) 10 μm thick Al foil. (7) X-ray CCD camera. The plasma waves and the plasma bubble formed by the interaction of the laser pulses with the gas targets are depicted in the inset. The generated X-rays and relativistic electrons are recorded simultaneously on a shot-to-shot basis.
    Typical relativistic electron spectral image (top), corresponding betatron-type X-ray image (middle), and corresponding shadowgram of the plasma channel (bottom) all recorded simultaneously from the interaction of the main laser pulse with the gas jet.
    Fig. 13. Typical relativistic electron spectral image (top), corresponding betatron-type X-ray image (middle), and corresponding shadowgram of the plasma channel (bottom) all recorded simultaneously from the interaction of the main laser pulse with the gas jet.
    The secondary coherent XUV source setup based on HHG. The red colour beam corresponds to the IR laser beam whereas the blue colour beam corresponds to the generated at the gas cell HHG XUV radiation, which is subsequently spectrally analysed by the diffraction grating and detected by the XUV CCD camera.
    Fig. 14. The secondary coherent XUV source setup based on HHG. The red colour beam corresponds to the IR laser beam whereas the blue colour beam corresponds to the generated at the gas cell HHG XUV radiation, which is subsequently spectrally analysed by the diffraction grating and detected by the XUV CCD camera.
    Typical XUV spectra generated in 80 mbar argon gas by 1 mJ laser pulses. They were obtained in scanning mode with the movable MCP detector and in shot-to-shot mode obtained with the XUV CCD camera shown in the inset.
    Fig. 15. Typical XUV spectra generated in 80 mbar argon gas by 1 mJ laser pulses. They were obtained in scanning mode with the movable MCP detector and in shot-to-shot mode obtained with the XUV CCD camera shown in the inset.
    Proton charge density at 250 fs of the simulation for (a) the high-contrast, free of pre-plasma case and (b) the case where intense pre-pulses generate pre-plasmas before the main pulse arrives.
    Fig. 16. Proton charge density at 250 fs of the simulation for (a) the high-contrast, free of pre-plasma case and (b) the case where intense pre-pulses generate pre-plasmas before the main pulse arrives.
    Proton phase space at 250 fs of the simulation for (a) the high-contrast, free of pre-plasma case and (b) the case where intense pre-pulses generate pre-plasmas before the main pulse arrives.
    Fig. 17. Proton phase space at 250 fs of the simulation for (a) the high-contrast, free of pre-plasma case and (b) the case where intense pre-pulses generate pre-plasmas before the main pulse arrives.
    Proton spectrum as a function of the energy for the case where there is no pre-plasma (blue line) at the front and rear of the target and for the case where there is pre-plasma (red line) at the front with 3.5 μm scale length and at the rear with 0.35 μm scale length.
    Fig. 18. Proton spectrum as a function of the energy for the case where there is no pre-plasma (blue line) at the front and rear of the target and for the case where there is pre-plasma (red line) at the front with 3.5 μm scale length and at the rear with 0.35 μm scale length.
    E. L. Clark, A. Grigoriadis, S. Petrakis, I. Tazes, G. Andrianaki, A. Skoulakis, Y. Orphanos, E. Kaselouris, I. Fitilis, J. Chatzakis, E. Bakarezos, V. Dimitriou, E. P. Benis, N. A. Papadogiannis, M. Tatarakis. High-intensity laser-driven secondary radiation sources using the ZEUS 45 TW laser system at the Institute of Plasma Physics and Lasers of the Hellenic Mediterranean University Research Centre[J]. High Power Laser Science and Engineering, 2021, 9(4): 04000e53
    Download Citation