Tunneling ionization of atoms and molecules induced by intense laser pulses contains the contributions of numerous quantum orbits. Identifying the contributions of these orbits is crucial for exploring the application of tunneling and for understanding various tunneling-triggered strong-field phenomena. We perform a combined experimental and theoretical study to identify the relative contributions of the quantum orbits corresponding to the electrons tunneling ionized during the adjacent rising and falling quarter cycles of the electric field of the laser pulse. In our scheme, a perturbative second-harmonic field is added to the fundamental driving field. By analyzing the relative phase dependence of the signal in the photoelectron momentum distribution, the relative contributions of these two orbits are unambiguously determined. Our results show that their relative contributions sensitively depend on the longitudinal momentum and modulate with the transverse momentum of the photoelectron, which is attributed to the interference of the electron wave packets of the long orbit. The relative contributions of these orbits resolved here are important for the application of strong-field tunneling ionization as a photoelectron spectroscopy for attosecond time-resolved measurements.
Laser-induced tunneling ionization of atoms and molecules is a fundamental process in strong-field physics. It is the first step for various intriguing phenomena in attosecond science, such as high-order above-threshold ionization,1 high-order harmonic generation,2 and enhanced double/multiple ionization.3–5 Therefore, detailed understanding of the tunneling step is of fundamental importance for attosecond science. In the past decades, great efforts have been made to reveal the dynamics of strong-field tunneling. For instance, the questions of how long it takes the electron to tunnel through the potential barrier6–8 and when the tunneling electron appears at the outside of the barrier have been surveyed in depth.9–11 The features of the tunneling electron wave packet have also been widely studied.12–16 Theoretically, tunneling ionization of atoms and molecules in a strong laser field could be understood with the quantum-orbit (QO) model.17 In the QO model, the relationship between the ionization time and the final momentum of photoelectrons for each orbit was established. For plenty of the time-resolved measurements, the attosecond dynamics were extracted based on this concept.18–22 The concept of the QO model also provides a transparent picture for dynamics of various tunneling-triggered processes.
One intrinsic issue in the QO model of tunneling ionization is that for the same final momentum multiple quantum orbits are involved.17,23,24 The interferences of these orbits obscure the insights into the attosecond time-resolved information recorded by the photoelectrons. Thus, identifying the quantum orbits is a prerequisite for understanding the dynamics of the strong field processes and for the time-resolved measurements. Specifically, there are two types of orbits within one optical cycle for strong-field tunneling ionization, referred to as the long and short orbits, which correspond to the electrons tunneling being ionized during the adjacent ascending and descending quarter cycles of electric field, respectively.25,26 For the electron ionized during the descending quarter cycle (the long orbit), the electron could return back to the parent ion, resulting in high-order harmonic generation or high-energy photoelectrons, while the electron ionized during the ascending quarter cycle (the short orbit) usually does not contribute to these signals. Thus, for the measurements based on these signals, only the long orbit is involved. However, for the photoelectrons with low energy (lower than , where is the ponderomotive energy), which has also been widely used to extract ultrafast electron dynamic information,18–22 both the long and short orbits contribute. Due to the Coulomb focusing effect after tunneling, it is accepted that the long orbit dominates over the short orbit for the signals in the photoelectron momentum distribution (PEMD), and thus temporal information is usually obtained based on the assumption that the long orbit contributes exclusively. Obviously, this approximation is questionable. In a recent experiment, it has been shown that the extracted ionization time with this approximation deviates significantly from the theoretical prediction.27 Recently, with the scheme of an orthogonal two-color field, the relative contributions of the long and short orbits were theoretically estimated.28,29 In that scheme, the relative contributions were obtained with two time-to-momentum maps of the short and long orbits. However, the effect of the Coulomb interaction on the ionization time in the orthogonal two-color field cannot be measured,30 and thus the maps used there are calculated based on a strong-field approximation where the ionization time is inaccurate. Instead, the parallel two-color field could record the Coulomb effect on the ionization time, and it can be employed to identify the contributions of the long and short orbits.30 So, in this study, we perform a combined experimental and theoretical study to determine the relative contributions of the long and short orbits in tunneling ionization with the parallel two-color field. We monitor the photoelectron yield as a function of the relative phase at each momentum of the PEMD. This relative phase dependence of the signal is determined by the ionization time, and thus it is different for the long and short orbits. With the Coulomb-corrected strong-field approximation (CCSFA), we calculate the relative phase dependences of the photoelectron yields for the long and short orbits separately. By comparing the measured relative phase dependence of the photoelectron yield with these theoretical data, the individual contributions of the long and short orbits in tunneling ionization are qualitatively determined. The obtained results show that their contributions depend on both the longitudinal and transverse momenta, and in certain regions of the PEMD, the contributions from the short orbit could be even higher than that of the long orbit. This information is crucial for accurately determining the ionization time of photoelectron in the PEMD, which is the basis of the time-resolved measurements with the photoelectron from tunneling.
2 Methods
In our scheme, the parallel two-color field consists of a strong 800 nm field and a much weaker second harmonic (SH) field, and it is polarized along the direction. In the experiment (see the Supplemental Materials for details about our experiment and the numerical calculation with CCSFA, which includes Ref. 31), the SH pulse was produced by frequency doubling a femtosecond laser pulse (25 fs, 800 nm, 1 kHz) from a Ti:sapphire laser system using a -thick -barium-borate crystal. The parallel two-color pulse was generated in a phase-locked Mach–Zehnder interferometer scheme. The relative phase was finely controlled by the phase-locking system.32,33 The parallel two-color pulse was tightly focused onto a supersonic gas jet of Ar by a concave silver mirror () in an ultrahigh vacuum chamber of a velocity map imaging setup.34 The PEMDs were then recorded as a function of the phase delay between the FM and SH fields, using a step size of . The peak intensities of FM and SH fields were and , respectively. The relative phase of the two-color field is calibrated by comparing the photoelectron yield obtained from the experiment with that obtained by solving the time-dependent Schrödinger equation (see the Supplemental Materials for details).
Sign up for Advanced Photonics TOC. Get the latest issue of Advanced Photonics delivered right to you!Sign up now
3 Results and Discussion
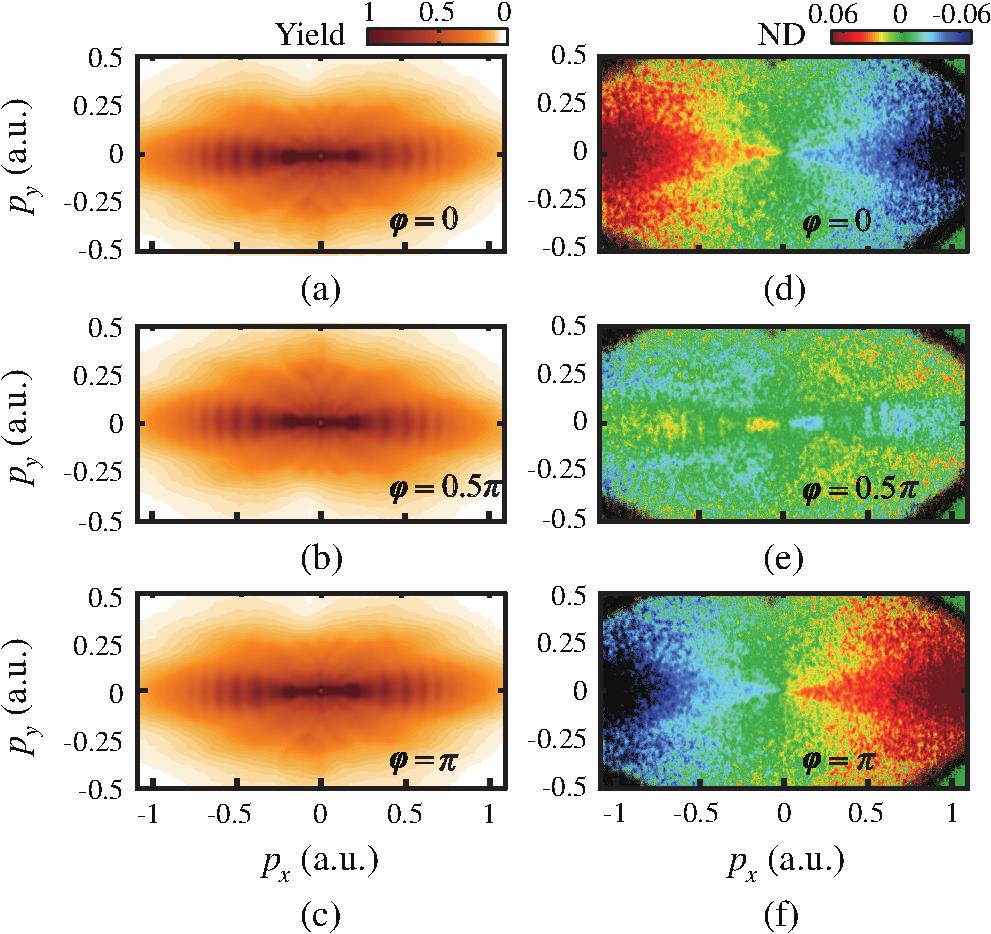
where is the PEMD at the relative phase of , and denotes the average distribution of the PEMDs for ranging from 0 to . Figures 1(d)–1(f) show the NDs at , , and , respectively. The relative phase dependence of the photoelectron yields can be clearly seen. For instance, the signals at are reduced and enhanced at and , respectively. For the signals at , the situation is reversed.
Figure 1.(a)–(c) The experimentally measured PEMDs for strong-field tunneling ionization of Ar by the parallel two-color () field with relative phase , , and , respectively. The laser intensities of the FM and SH fields are and , respectively. (d)–(f) NDs for the distributions in (a)–(c) (see text for details).
where characterizes the amplitude of the modulation, and it is irrelevant in this study (we drop this factor in the analysis below). indicates the relative phase where maximizes. The optimal phase depends on both the transverse and longitudinal momenta, as shown in Figs. 2(b) and 2(c). We perform this analysis to each momentum in the PEMDs, and the obtained is shown in Fig. 2(d). To see the momentum dependence of the phase more clearly, three cuts at , , and a.u. from Fig. 2(d) are shown in Fig. 2(e). It is shown that the phase oscillates between and as changes, and when increases from to a.u. the phase shifts to smaller values. In the following, we will show that this quantity encodes information about the relative contributions of the long and short orbits in tunneling ionization.
Figure 2.(a) The ND as a function of for the momentum a.u. The open circles show the experimental data and the green curve shows the fitted results. (b) The fitted ND by Eq. (2) as a function of for the momentum (blue curve), (purple curve), and a.u. (green curve). The data are normalized such that the maximum of each curve is unity. (c) Same as (b) but for (black curve), (red curve), and a.u. (yellow curve). (d) The optimal phase in the region of a.u. and a.u. (e) Cuts of at a.u. (red crosses), a.u. (green squares), and a.u. (blue triangles). The error bars show the 95% confidence interval in fitting.
In the two-color field, it is intuitive that the photoelectron yield at momentum maximizes at the relative phase where the instantaneous electric field at ionization maximizes.30 Thus, the optimal phase is determined by the ionization time. However, the situation is more complex when multiple orbits contribute to the signal in the PEMDs. In Fig. 3(a), we illustrate the two orbits (the long and short orbits) within one optical cycle that contribute to the PEMDs. Due to the different ionization times of the long and short orbits, the photoelectron yields corresponding to these two orbits should maximize at different relative phases. The experimentally measured optimal phase provides us with a way to assess the contributions of these two orbits.
Figure 3.(a) Illustration of the ionization times of the long and short orbits in strong-field tunneling ionization. The long and short orbits correspond to the ionization events, where the electron is released at the falling and rising edges of electric field, respectively. The blue curve indicates the electric field of the FM field and the red curve shows its vector potential. (b) The for the long orbit with transverse momentum , calculated by CCSFA. The solid red curve indicates the optimal phase . (c) The same as (b) but for the short orbit. The black arrow denotes the phase window formed by and . (d) The optimal phase of the long orbit for a.u. and a.u. (e) The same as (d) but for the short orbit.
To this end, the key information is the optimal phase for each orbit. In the previous studies with a scheme of an orthogonal two-color field, this information is obtained with the strong-field approximation, where the Coulomb effect on the tunneling ionized electron is neglected.28,29 For more accurate optimal phases, it is necessary to include the effect of Coulomb interaction on the relationship of the ionization time and final momentum. This is crucial for our parallel two-color field. Thus, we calculate the modulation of the photoelectron yield as a function of the relative phase at each momentum with the CCSFA (see Supplemental Materials for details), the accuracy of which has been well confirmed.42–45Figures 3(b) and 3(c) show the calculated NDs as functions of the relative phases for the long and short orbits, respectively. Here, we display the signals at zero transverse momentum. It is shown that for the long orbit the phase where the ND maximizes varies from to as increases from to a.u., and for the short orbit, the phase changes from to . For each momentum, we repeat our calculation in the PEMD and extract the optimal phase . The results of the long and short orbits are shown in Figs. 3(d) and 3(e), respectively.
In the measured PEMDs, both the long and short orbits contribute, and the relative phase should locate within the phases window determined by the long and short orbits. Two examples are shown in Figs. 4(a) and 4(b). For a.u. in Fig. 4(a), the optimal phases determined by the long and short orbits are and . As expected, the optimal phase of the measured data is located between these values, and it is closer to the value of the long orbit, implying that the long orbit has the dominant contributions. For a.u., the phase of the experimentally measured data shifts toward the short orbit, meaning that the contributions of the short orbit increase.
Figure 4.(a) The ND at a.u. as a function of . The solid green and purple curves show the theoretical results of the signal from the long and short orbits, respectively. The black squares represent the experimental data, where both the long and short orbits contribute. The dashed blue lines indicate the optimal phases and , and the blue arrow denotes their phase window. (b) The same as (a) but for a.u. (c) The ratios extracted from the experimental data. (d) The cuts of at (red circles), (green squares), and a.u. (purple triangles), respectively.
where and denote the corresponding coefficients for the contributions of long and short orbits, respectively. and are the optimal phases for the long and short orbits [as shown in Figs. 3(d) and 3(e)], respectively. Note that in Eq. (3) the interference term of the long and short orbits has been dropped because in experiment this type of interference is not visible, as shown in Fig. 1. Fitting the experimental data with Eq. (3), the coefficients and are obtained. For the data in Figs. 4(a) and 4(b), the obtained relative contributions of the two orbits are 2.02 and 0.59, respectively. We perform this fitting to each momentum in the PEMDs with and , and the obtained ratio is shown in Fig. 4(c). The result indicates that the relative contributions of the long and short orbits sensitively depend on both the longitudinal and transverse momenta. For the distribution along the axis, the long orbit has the main contributions, while for the distribution around a.u., the ratio is very close to unity, meaning that the long and short orbits have comparable contributions to the photoelectron yield. This behavior is due to the holographic interference in the long orbit. For the long orbit, the electron can be driven back to the parent ion after tunneling ionization, and the electron wave packet is split into two pathways. One suffers a near-forward recollision and the other without recollision. The two pathways give rise to the interference in the PEMDs.18,36 At the interference maxima or minima, the contributions of the long orbit are enhanced or suppressed, leading to the modulation of the ratio with the transverse momentum.
In the time-resolved measurements using photoelectrons from strong-field tunneling ionization, a map of time-to-momentum is necessary for extracting attosecond dynamics. In previous studies, this map was established using the long orbit, because it was assumed that the contributions of the long orbit dominate the signal in the PEMDs.27 Due to the constructive holographic interference, it is true that for the signal in the PEMD along the laser polarization direction, the contribution of the long orbit is larger than that of the short orbit. However, the ratio is only about four times higher, as shown in Fig. 4(c). Neglecting the contributions of the short orbit leads to the inaccuracy of the time-to-momentum map. Specifically, at the minimum of the holographic interference, the contributions of the short orbit could be even larger than that of the long orbit, as shown in Fig. 4(d). So, the time-resolved studies of revealing attosecond dynamics with the time-to-momentum map solely based on the long orbit are invalid. The inaccuracy of this map induced by the multiple orbits has also been realized in a very recent study.41 Furthermore, we should mention that in our scheme the multiple cycle pulses are used. For the multiple cycle pulses, the electric field during the adjacent rising and falling quarter cycles is the same, and the relative contributions of these two orbits are the same from cycle to cycle. However, in the few cycle pulses, the electric field of the adjacent quarter cycles is different, and the relative contributions of these orbits are different from cycle to cycle. Thus, for the few cycle pulses the scheme will break down.
4 Conclusions
We have experimentally determined the contributions of the long and short orbits in strong-field tunneling ionization. Due to the holographic interference of the electrons of the long orbits, the relative contributions of the long and short orbits depend on both the transverse and longitudinal momenta. At the holographic interference minimum, the contributions of the long orbit are even less than that of the short orbit. In previous studies, the ionization time of the photoelectron is usually determined based on the assumption that the long orbit dominates the photoelectron yields. Our results indicate this assumption is invalid, and it will induce inaccuracy in determining the time-to-momentum map. Our study provides a complete map to quantify the relative contributions of different quantum orbits for the signal at each momentum in the PEMDs. This information is necessary for establishing accurate correspondence between the ionization time and the final photoelectron momentum in the PEMDs, and thus it is important for the application of strong-field tunneling ionization as a photoelectron spectroscopy to probe atom and molecule dynamics in attosecond scale.