
Sensen Li, Yulei Wang, Zhiwei Lu, Lei Ding, Yi Chen, Pengyuan Du, Dexin Ba, Zhenxing Zheng, Xin Wang, Hang Yuan, Chengyu Zhu, Weiming He, Dianyang Lin, Yongkang Dong, Dengwang Zhou, Zhenxu Bai, Zhaohong Liu, Can Cui, "Hundred-Joule-level, nanosecond-pulse Nd:glass laser system with high spatiotemporal beam quality," High Power Laser Sci. Eng. 4, 01000e10 (2016)
- High Power Laser Science and Engineering
- Vol. 4, Issue 1, 01000e10 (2016)
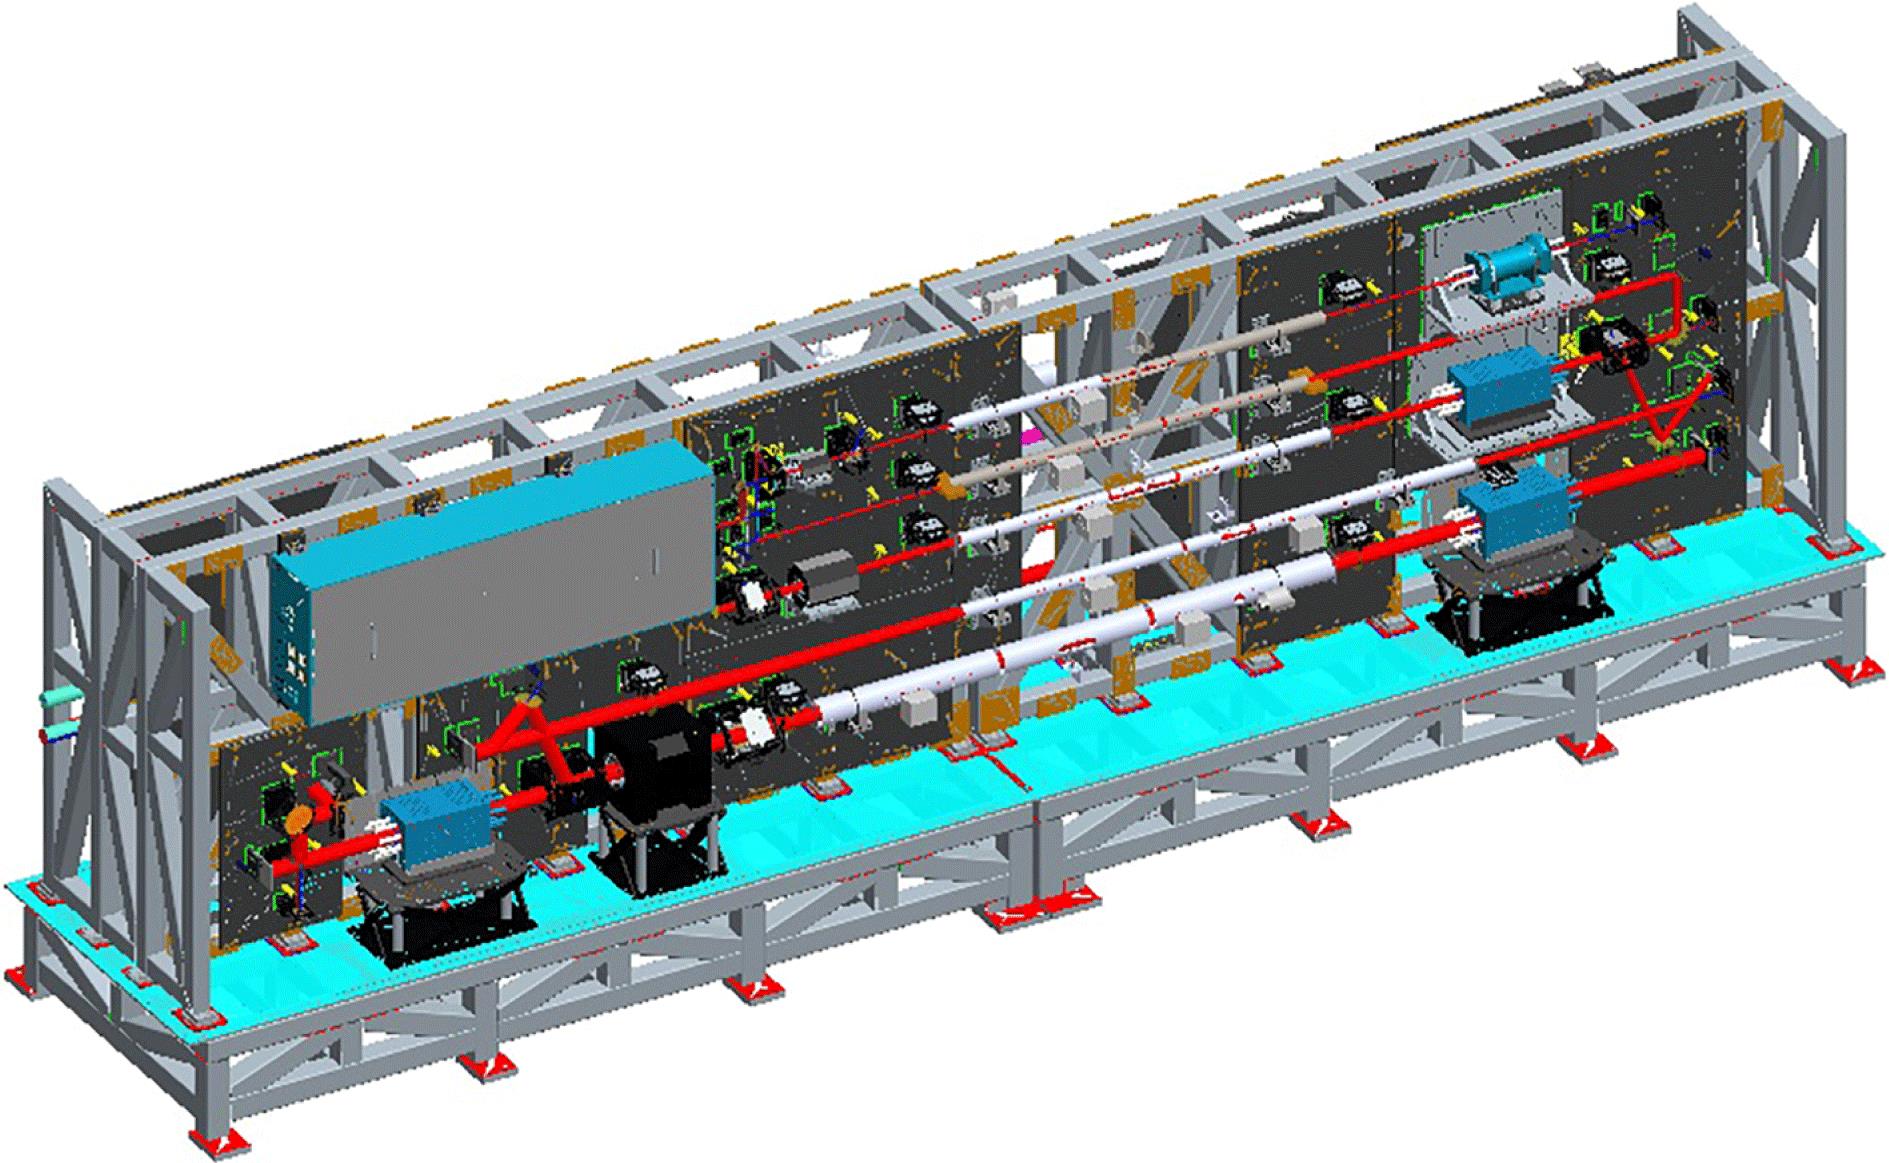
Fig. 1. The 3D drawings of the main part of the 100-J-level laser system.
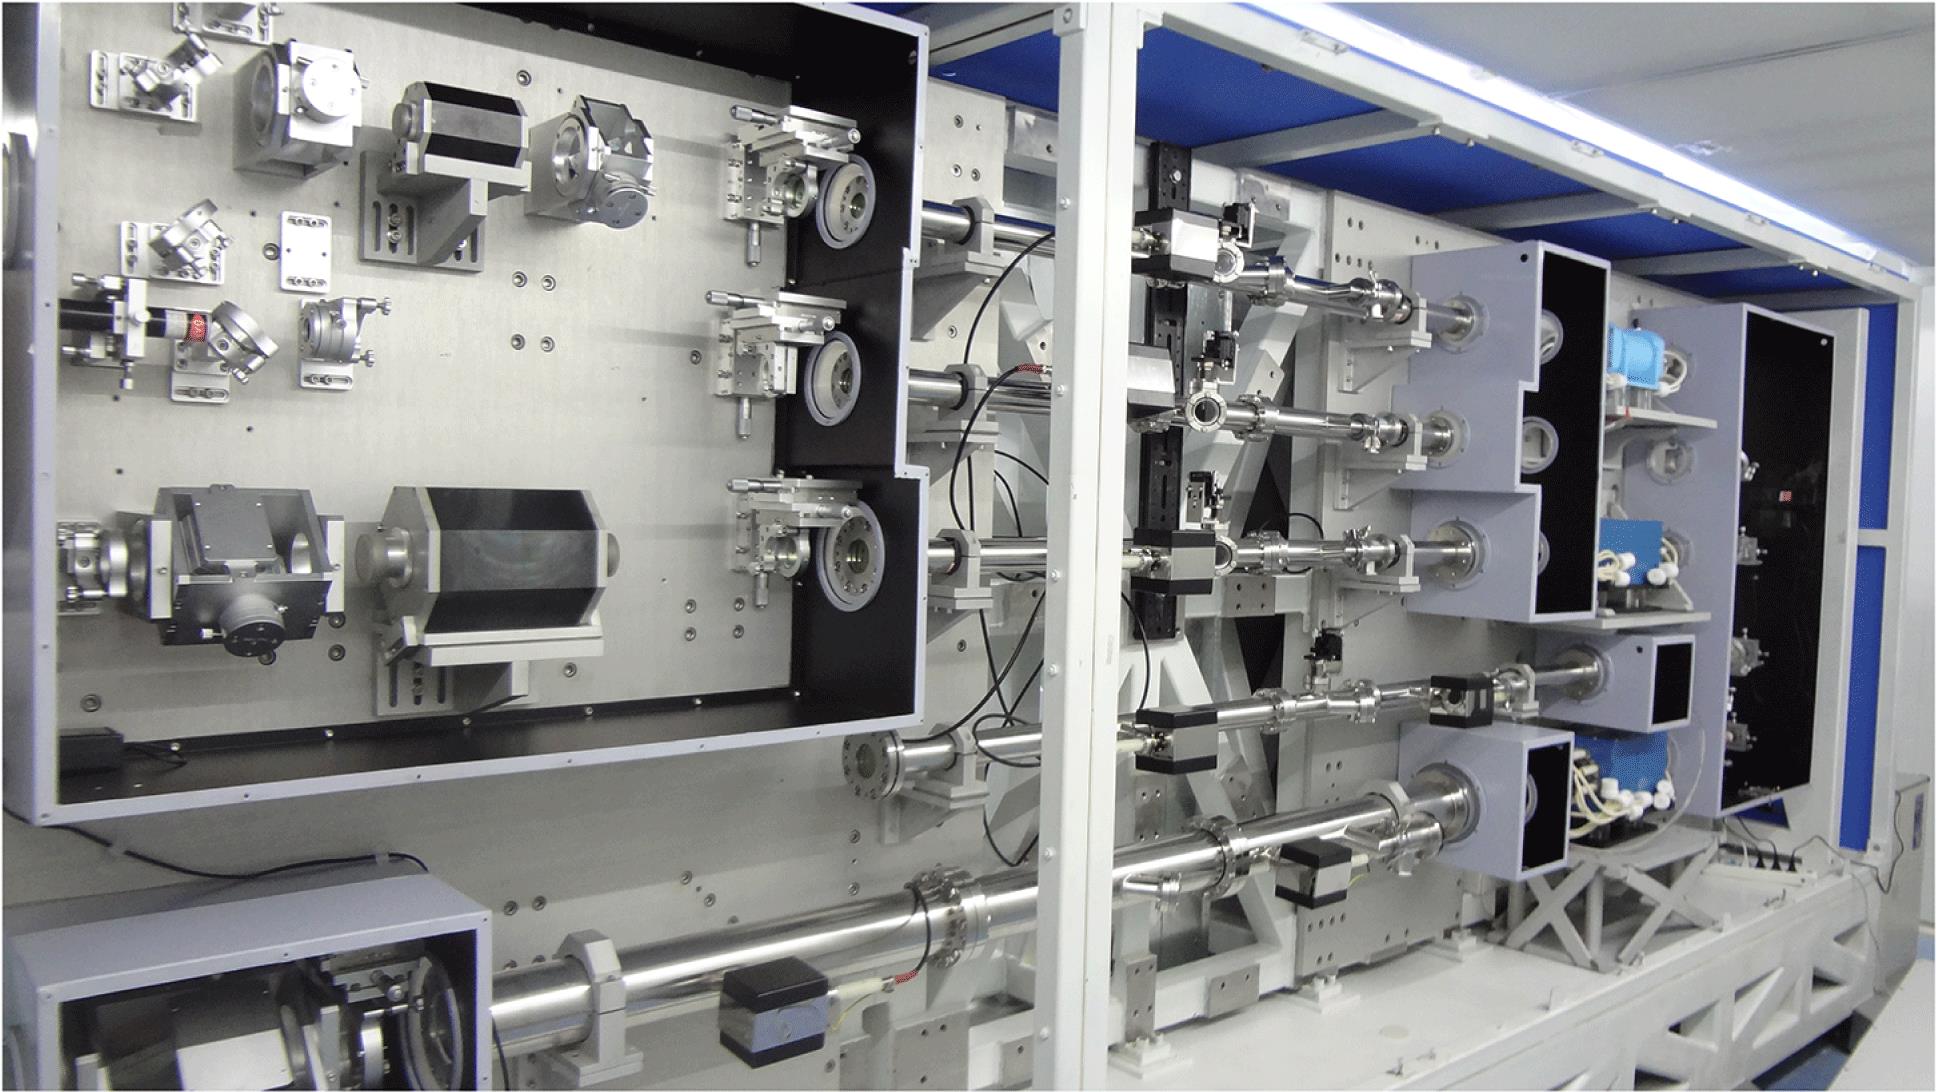
Fig. 2. Photograph of the 100-J-level laser system.
Fig. 3. The overall schematic of the 100-J-level laser system. The blue two-direction arrow real lines refer to the relay image plane. P1–P7, polarizer; FR1–FR3, Faraday rotator; HWP, half-wave plate; CSF, cavity spatial filter in the main amplifier system; TSF, transport spatial filter; THG, third-harmonic generator; ${\it\Phi}$ 20, ${\it\Phi}$ 40 and ${\it\Phi}$ 70 rod Amp, 20, 40 and 70-mm-diameter Nd:phosphate glass rod amplifiers; $1{\it\omega}$ and $3{\it\omega}$ Diagrams refer to the respective beam diagnostic units.
Fig. 4. Schematic of the front-end system. The four main sections are the CW oscillator, the AWG, the Yb-doped fiber amplifiers (YDFA) and the polarize controller. IM, intensity modulator; PM, phase modulator; AOM, acousto-optic modulator used for chopping and isolating.
Fig. 5. Schematic of the preamplifier. ${\it\lambda}/2$ , half-wave plate; ${\it\lambda}/4$ , quarter-wave plate; P01–P07, polarizers; FR01–FR03, Faraday rotator; L1, long-focal-length lens; PC, Pockels cells; Amp1, 2-mm-diameter Nd:phosphate glass rod amplifier heads; Amp2 and Amp3, 3-mm-diameter rod amplifier heads; Amp4 and Amp5, 6-mm-diameter rod amplifier heads; R1, $45^{\circ }$ quartz polarization rotator; R2, $90^{\circ }$ quartz polarization rotator.
Fig. 6. The energy stability of the preamplifier.
Fig. 7. Schematic of the beam shaper of the laser system.
Fig. 8. Two-pass 20-mm-diameter rod amplifier.
Fig. 9. Photographs of the rod amplifiers.
Fig. 10. Main amplifier gain data of optical output versus optical input energies.
Fig. 11. The frequency converter system layout. CS1–CS4, spectral mirrors with special coating layer.
Fig. 12. Conversion efficiency to third harmonic. The data are for a 5 ns input 1${\it\omega}$ pulse width and for a ${\it\Phi}$ 58 mm beam.
Fig. 13. The output energy stability in six shots.
Fig. 14. The $1{\it\omega}$ and $3{\it\omega}$ output 3 and 5 ns temporal pulses.
Fig. 15. The $1{\it\omega}$ and $3{\it\omega}$ output near field by spatial beam shaping. The $1{\it\omega}$ near field (a) and the lineout gray distribution (b), the $3{\it\omega}$ near field (c) and the lineout gray distribution (d).
Fig. 16. The $1{\it\omega}$ output wavefront (a) and the far field (b) without DM, and $1{\it\omega}$ output wavefront (c) and the far field (d) after wavefront shaping.


Set citation alerts for the article
Please enter your email address

© Copyright 2018-2021 | Chinese Laser Press. All Rights Reserved 沪ICP备15018463号-20