
Yu.A. Malkov, A.N. Stepanov, D.A. Yashunin, L.P. Pugachev, P.R. Levashov, N.E. Andreev, K.Yu. Platonov, A.A. Andreev. Collimated quasi-monochromatic beams of accelerated electrons in the interaction of a weak-contrast intense femtosecond laser pulse with a metal foil[J]. High Power Laser Science and Engineering, 2013, 1(2): 02000080
- High Power Laser Science and Engineering
- Vol. 1, Issue 2, 02000080 (2013)
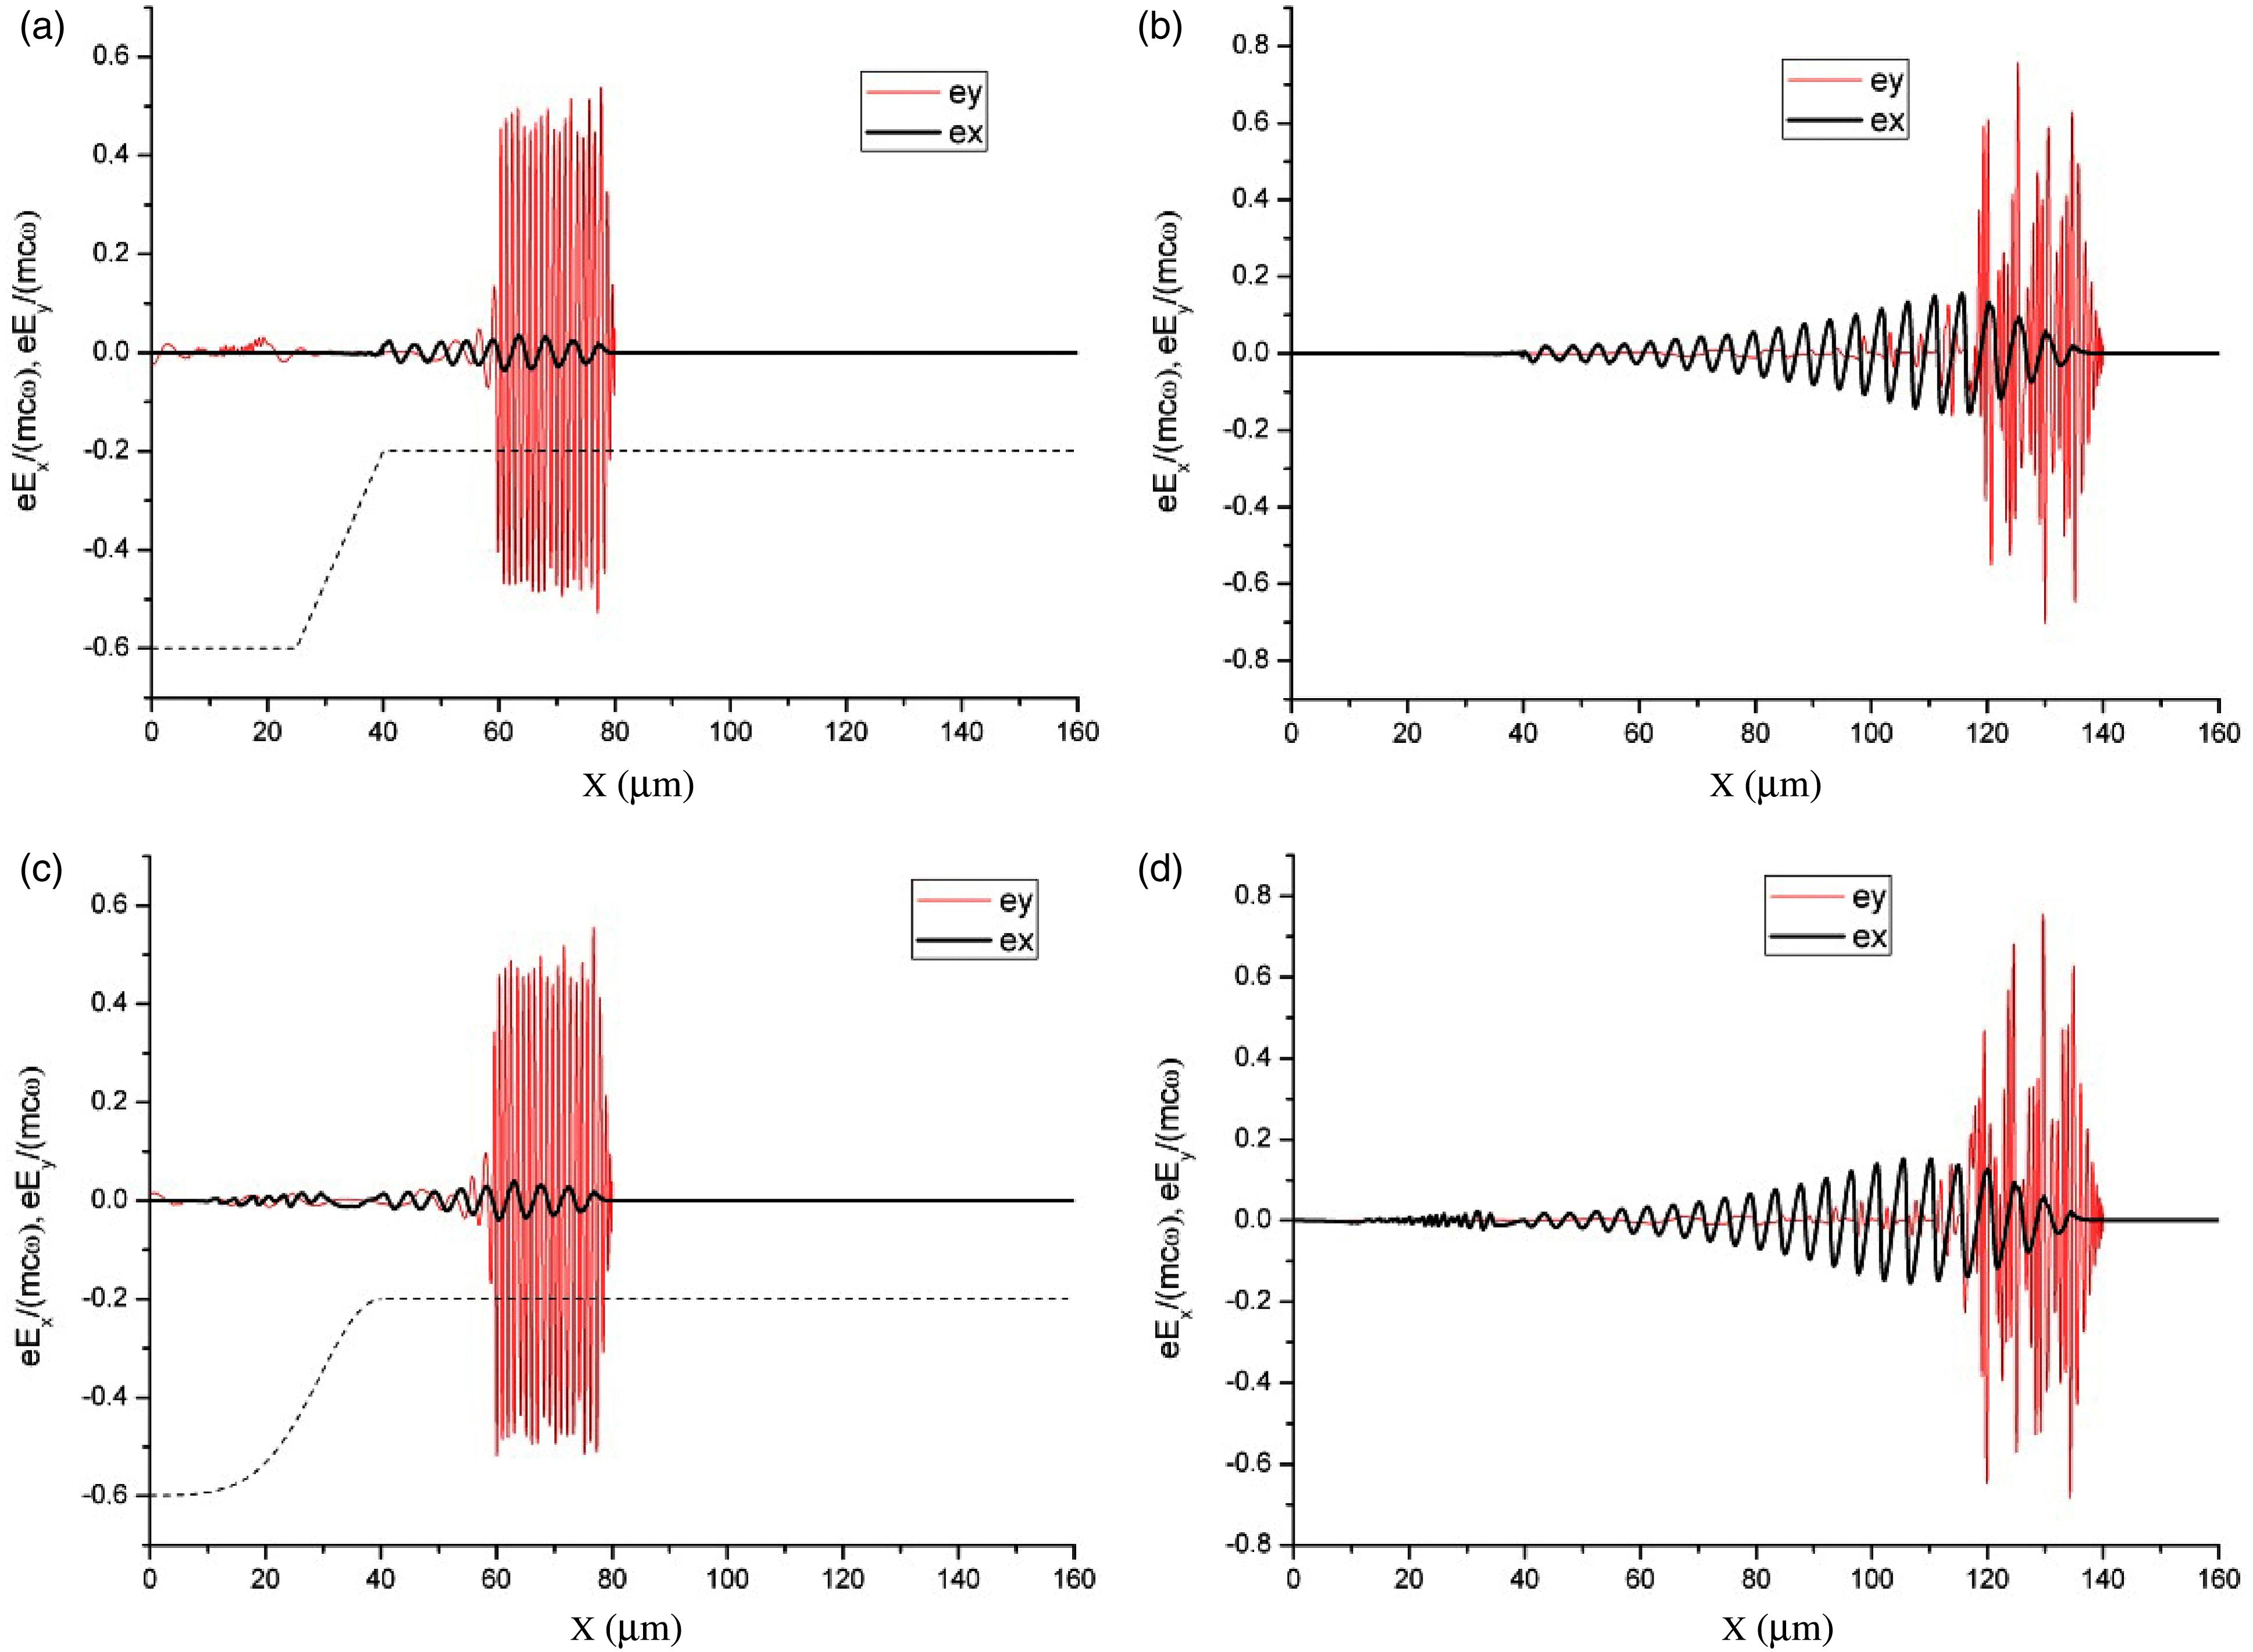
Fig. 1. Dimensionless projections of the electric field vector at  (
( ) (a, c) and
  (
( ) (b, d) for linear (a, b) and Gaussian (c, d) input plasma density profiles. The plasma density profiles are shown by dashed curves in parts a and c.
() (a, c) and () (b, d) for linear (a, b) and Gaussian (c, d) input plasma density profiles. The plasma density profiles are shown by dashed curves in parts a and c. 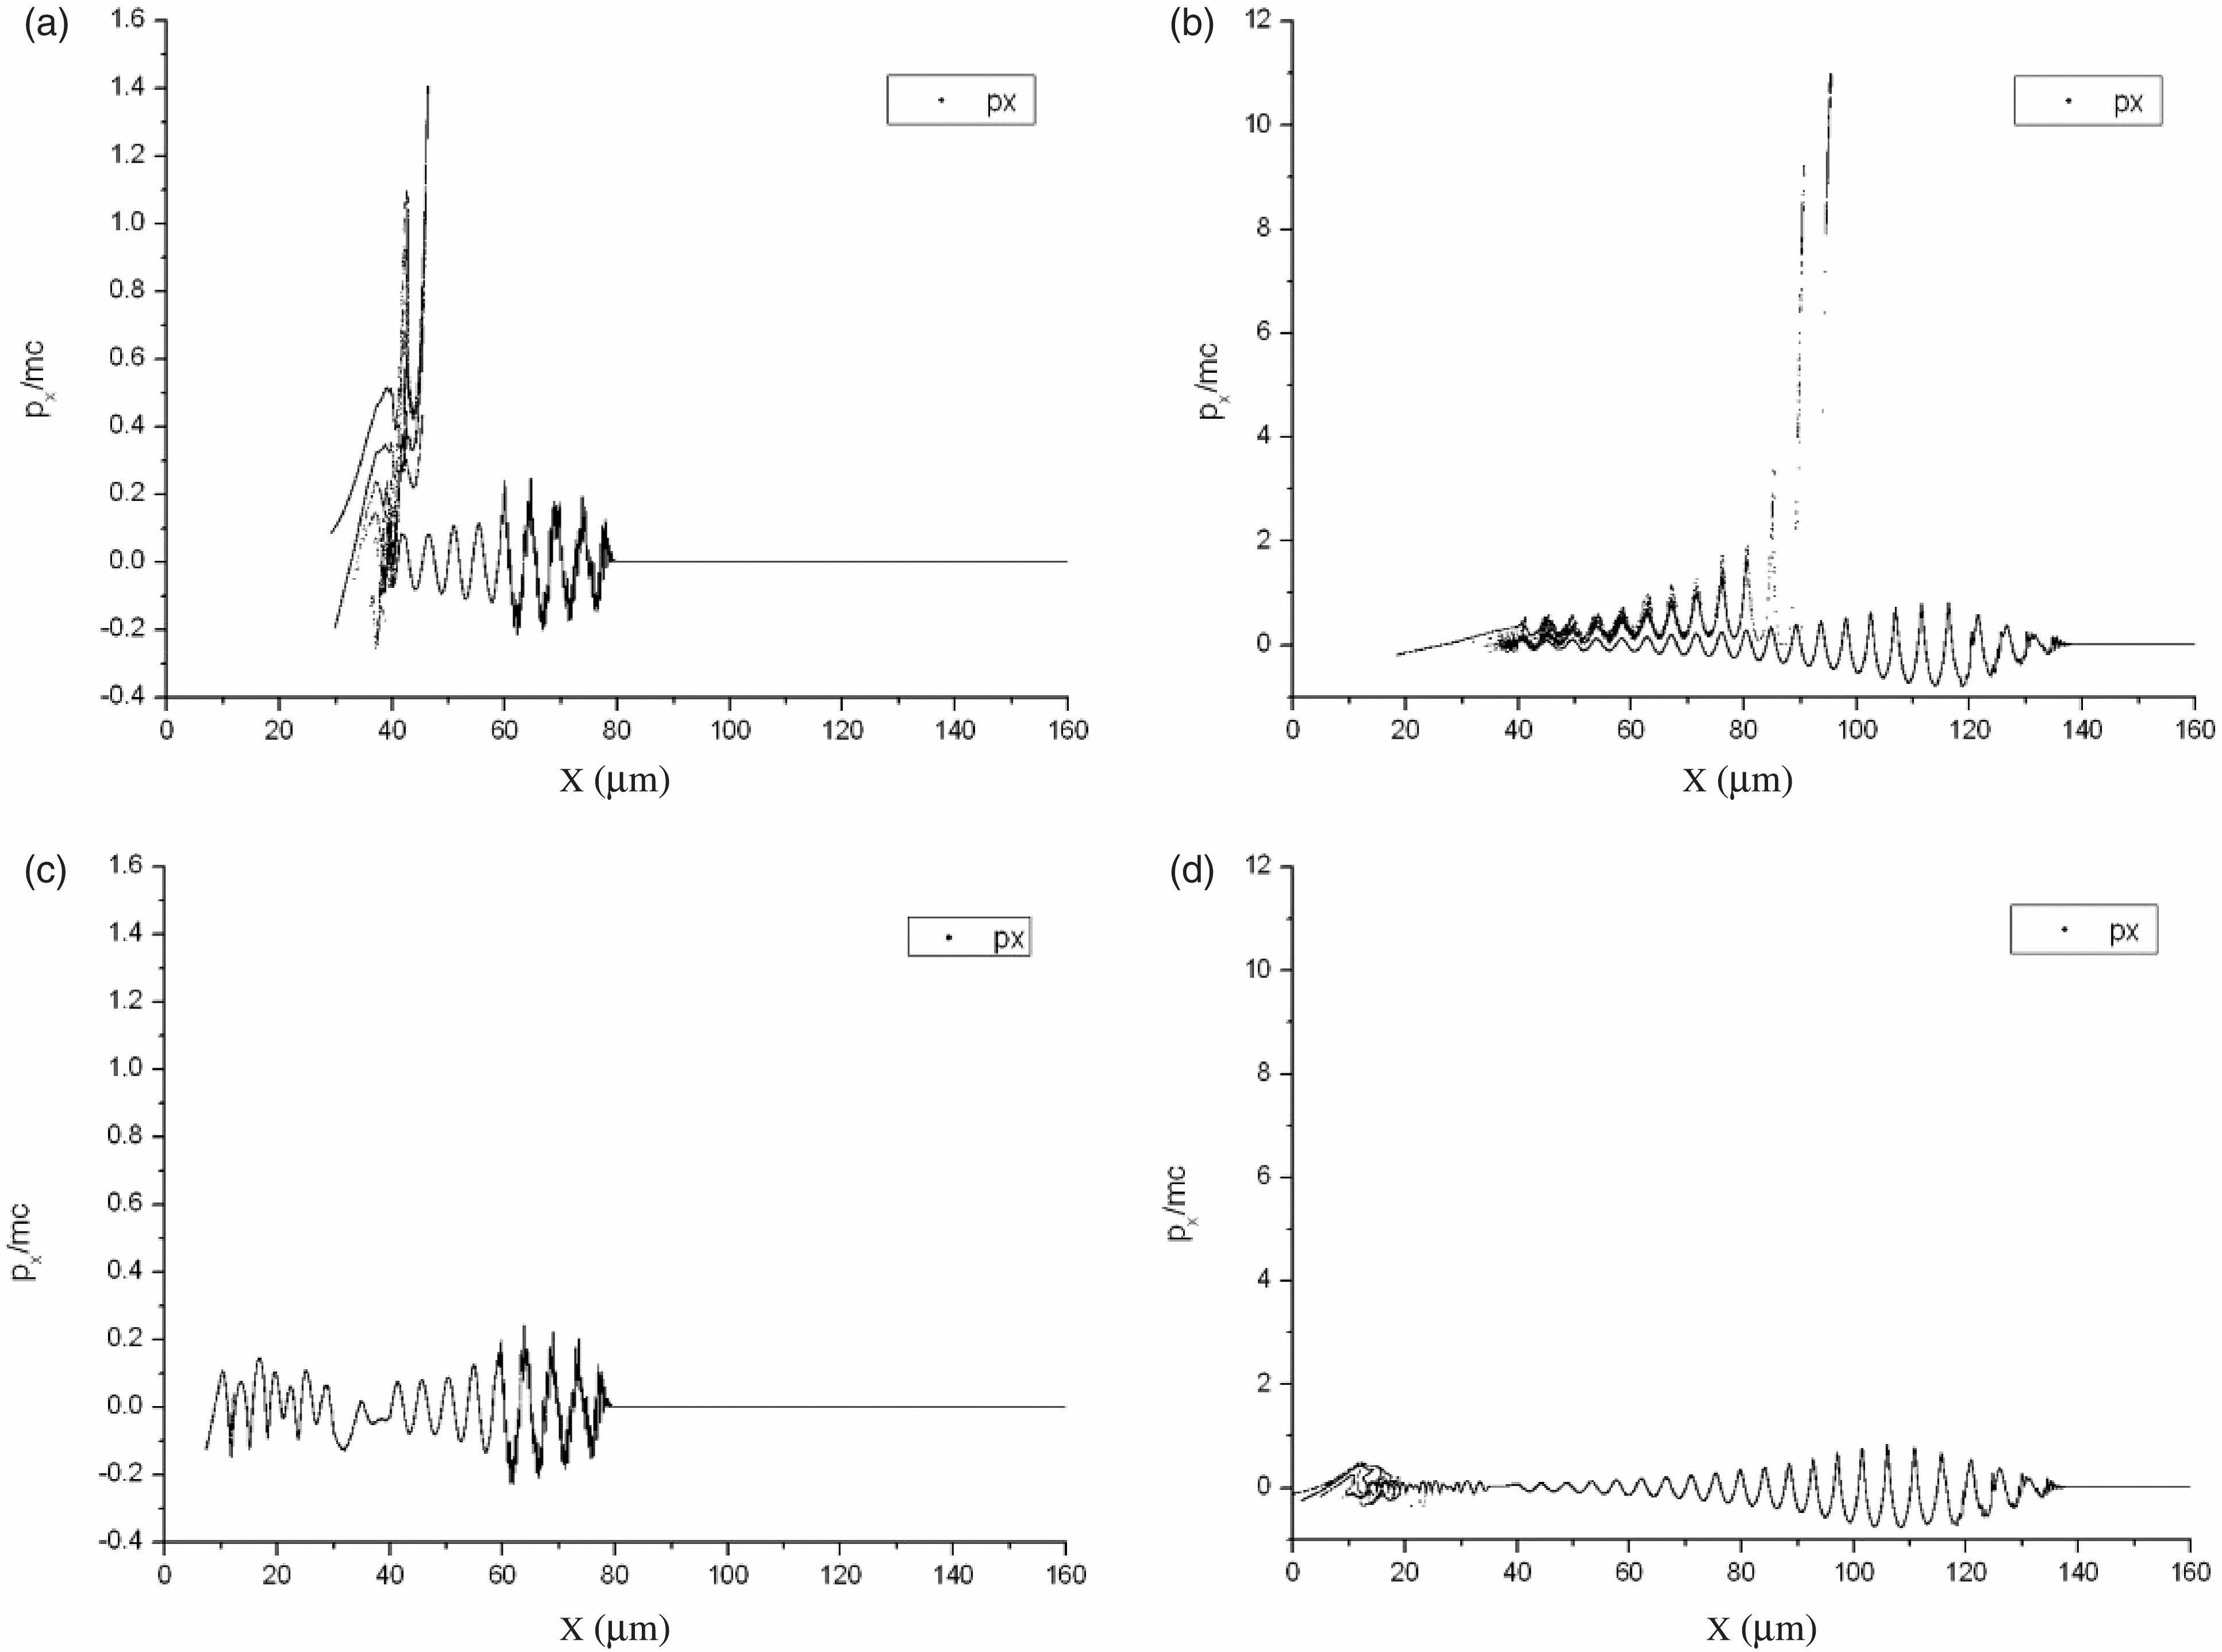
Fig. 2. Phase plane of electrons at  (
( ) (a, c) and
  (
( ) (b, d) for linear (a, b) and Gaussian (c, d) plasma density profile at the layer input.
() (a, c) and () (b, d) for linear (a, b) and Gaussian (c, d) plasma density profile at the layer input. Fig. 3. Energy spectra of electrons at  (
( ) on (a) logarithmic and (b) linear scales for a linear plasma density profile at the layer input. The number of electrons per transverse (with respect to the
  -axis) cross section with area
  per unit energy (in MeV) is plotted on the vertical axes.
() on (a) logarithmic and (b) linear scales for a linear plasma density profile at the layer input. The number of electrons per transverse (with respect to the -axis) cross section with area per unit energy (in MeV) is plotted on the vertical axes. Fig. 4. Phase diagrams ( ) (a) and (
 ) (b) at
  for sharp density gradient.
) (a) and () (b) at for sharp density gradient. Fig. 5. Electron energy distribution at  , the angle of observation is
  .
.
, the angle of observation is . Fig. 6. The geometry of interaction of the laser pulse and foil.
Fig. 7. Angular distribution of electron beam formed by focusing laser radiation onto the foil edge.
Fig. 8. Typical distribution of scintillation screen luminescence (a) and experimental electron energy spectra (b) with a single peak (black) and with two peaks (red). The blue lines in (a) correspond to different electron energies. The red lines correspond to projections of the slit on the scintillator screen.

Set citation alerts for the article
Please enter your email address
© Copyright 2018-2021 | Chinese Laser Press. All Rights Reserved 沪ICP备15018463号-20