• Chinese Optics Letters
  • Vol. 18, Issue 3, 033501 (2020)
Ningning Liu1, Mohan Wang1, Zongyuan Tang1, Lin Gao1, Shuai Jing1, Na Gao1, Hongyu Xing1、**, Xiangshen Meng2, Zhenghong He2, Jian Li2, Minglei Cai3、4, Xiaoyan Wang3、4, and Wenjiang Ye1、*
Author Affiliations
  • 1School of Sciences, Hebei University of Technology, Tianjin 300401, China
  • 2School of Physical Science and Technology, Southwest University, Chongqing 400715, China
  • 3Hebei Jiya Electronics Co., Ltd., Shijiazhuang 050071, China
  • 4Hebei Provincial Research Center of LCD Engineering Technology, Shijiazhuang 050071, China
  • show less
    DOI: 10.3788/COL202018.033501 Cite this Article Set citation alerts
    Ningning Liu, Mohan Wang, Zongyuan Tang, Lin Gao, Shuai Jing, Na Gao, Hongyu Xing, Xiangshen Meng, Zhenghong He, Jian Li, Minglei Cai, Xiaoyan Wang, Wenjiang Ye. Influence of γ-Fe2O3 nanoparticles doping on the image sticking in VAN-LCD[J]. Chinese Optics Letters, 2020, 18(3): 033501 Copy Citation Text show less
    Structure of VAN cell.
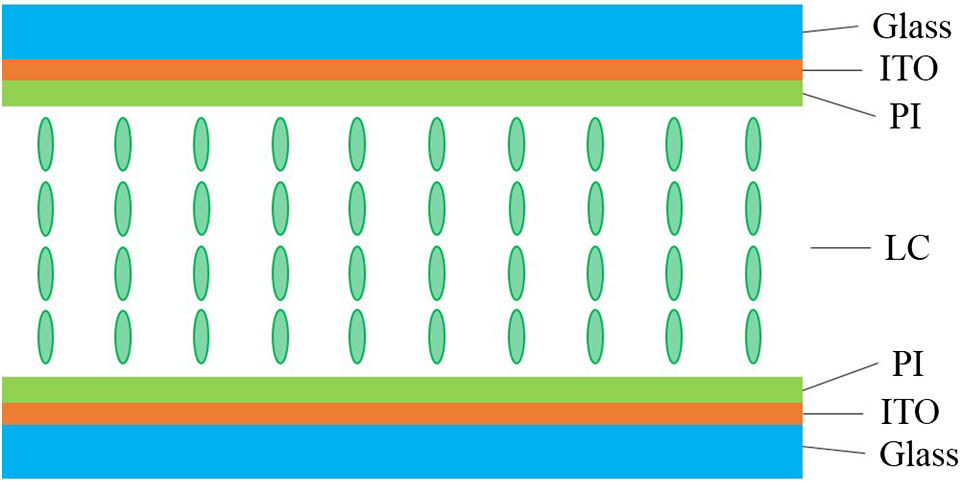
    Fig. 1. Structure of VAN cell.
    Experimental device for evaluating image sticking by the capacitance voltage method.
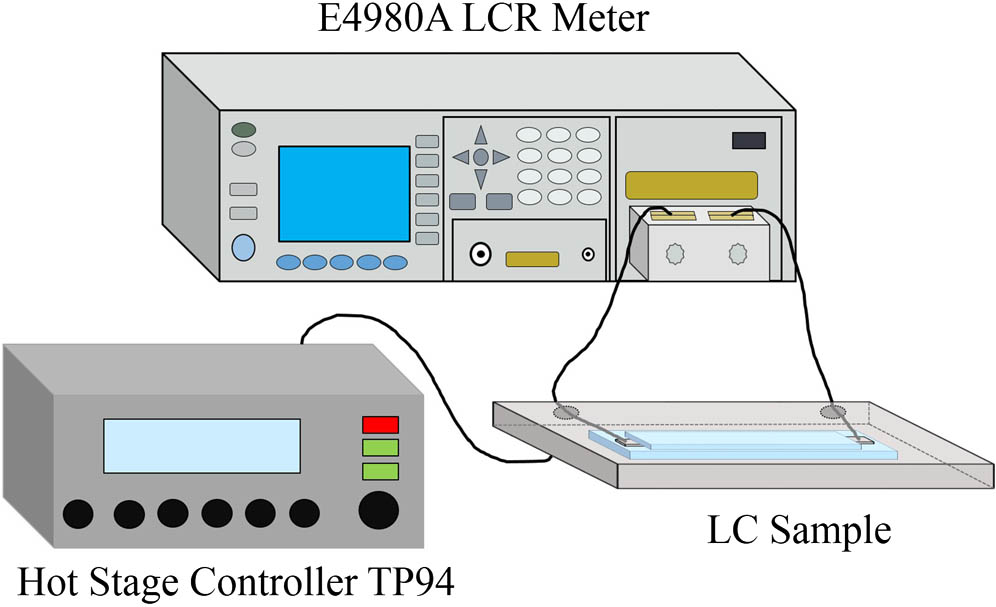
    Fig. 2. Experimental device for evaluating image sticking by the capacitance voltage method.
    C-U curve and RDCV evaluation principle of FFS1 in the VAN cell.
    Fig. 3. C-U curve and RDCV evaluation principle of FFS1 in the VAN cell.
    Curve of capacitance slope variation with AC voltage in negative LC FFS1 in VAN cell.
    Fig. 4. Curve of capacitance slope variation with AC voltage in negative LC FFS1 in VAN cell.
    VAN cell response time measurement setup.
    Fig. 5. VAN cell response time measurement setup.
    Curve of RDCV in VAN cell varies with time when DCB is 0.4 V, 0.6 V, and 0.8 V, respectively.
    Fig. 6. Curve of RDCV in VAN cell varies with time when DCB is 0.4 V, 0.6 V, and 0.8 V, respectively.
    TEM image of γ-Fe2O3 nanoparticles: (a) 43,000 times, (b) 97,000 times.
    Fig. 7. TEM image of γ-Fe2O3 nanoparticles: (a) 43,000 times, (b) 97,000 times.
    POM image of PAN cell undoped and doped with different concentrations of γ-Fe2O3 nanoparticles. (a) Undoped, (b) 0.017 wt.%, (c) 0.034 wt.%, (d) 0.051 wt.%, (e) 0.068 wt.%, (f) 0.136 wt.%, (g) 0.204 wt.%, and (h) 0.272 wt.%. A and P represent the perpendicular analyzer and polarizer, respectively, and n represents the rubbing direction of PI.
    Fig. 8. POM image of PAN cell undoped and doped with different concentrations of γ-Fe2O3 nanoparticles. (a) Undoped, (b) 0.017 wt.%, (c) 0.034 wt.%, (d) 0.051 wt.%, (e) 0.068 wt.%, (f) 0.136 wt.%, (g) 0.204 wt.%, and (h) 0.272 wt.%. A and P represent the perpendicular analyzer and polarizer, respectively, and n represents the rubbing direction of PI.
    Relationship between SRDCV and doping concentration in the 3.85 μm VAN cell under 0.4 V, 0.6 V, and 0.8 V DCB.
    Fig. 9. Relationship between SRDCV and doping concentration in the 3.85 μm VAN cell under 0.4 V, 0.6 V, and 0.8 V DCB.
    Relationship between SRDCV and doping concentration in the 11.5 μm VAN cell under 0.6 V DCB.
    Fig. 10. Relationship between SRDCV and doping concentration in the 11.5 μm VAN cell under 0.6 V DCB.
    Decay and rise times at different doping concentrations in the 11.5 μm VAN cell.
    Fig. 11. Decay and rise times at different doping concentrations in the 11.5 μm VAN cell.
    Relationship between doping concentration and response time. (a) Normalized transmittance and decay time. (b) Normalized transmittance and rise time. (c) Decay time and doping concentration. (d) Rise time and doping concentration.
    Fig. 12. Relationship between doping concentration and response time. (a) Normalized transmittance and decay time. (b) Normalized transmittance and rise time. (c) Decay time and doping concentration. (d) Rise time and doping concentration.
    SamplesClearing Point (°C)Uth (V)Δεk33 (pN)γ1 (mPa·s)
    Undoped FFS178.71.9884.21214.9327.71
    FFS1+0.017wt.% γ-Fe2O378.81.9683.99413.8825.65
    FFS1+0.034wt.% γ-Fe2O378.81.9754.04314.1526.19
    FFS1+0.051wt.% γ-Fe2O379.01.9744.24914.8527.53
    FFS1+0.068wt.% γ-Fe2O379.11.9714.04414.0826.31
    FFS1+0.136wt.% γ-Fe2O380.61.9594.32214.8727.79
    FFS1+0.204wt.%γ-Fe2O380.81.9514.38814.9727.99
    FFS1+0.272wt.% γ-Fe2O382.21.9334.49315.0628.18
    Table 1. Negative LC Parameters with Undoped and Doped γ-Fe2O3 Nanoparticles
    Ningning Liu, Mohan Wang, Zongyuan Tang, Lin Gao, Shuai Jing, Na Gao, Hongyu Xing, Xiangshen Meng, Zhenghong He, Jian Li, Minglei Cai, Xiaoyan Wang, Wenjiang Ye. Influence of γ-Fe2O3 nanoparticles doping on the image sticking in VAN-LCD[J]. Chinese Optics Letters, 2020, 18(3): 033501
    Download Citation