
Ying ZHU, Ming ZHAO. Registration of Laser Point Cloud and Optical Image in Urban Area Based on Semantic Segmentation[J]. Acta Photonica Sinica, 2021, 50(1): 188
- Acta Photonica Sinica
- Vol. 50, Issue 1, 188 (2021)
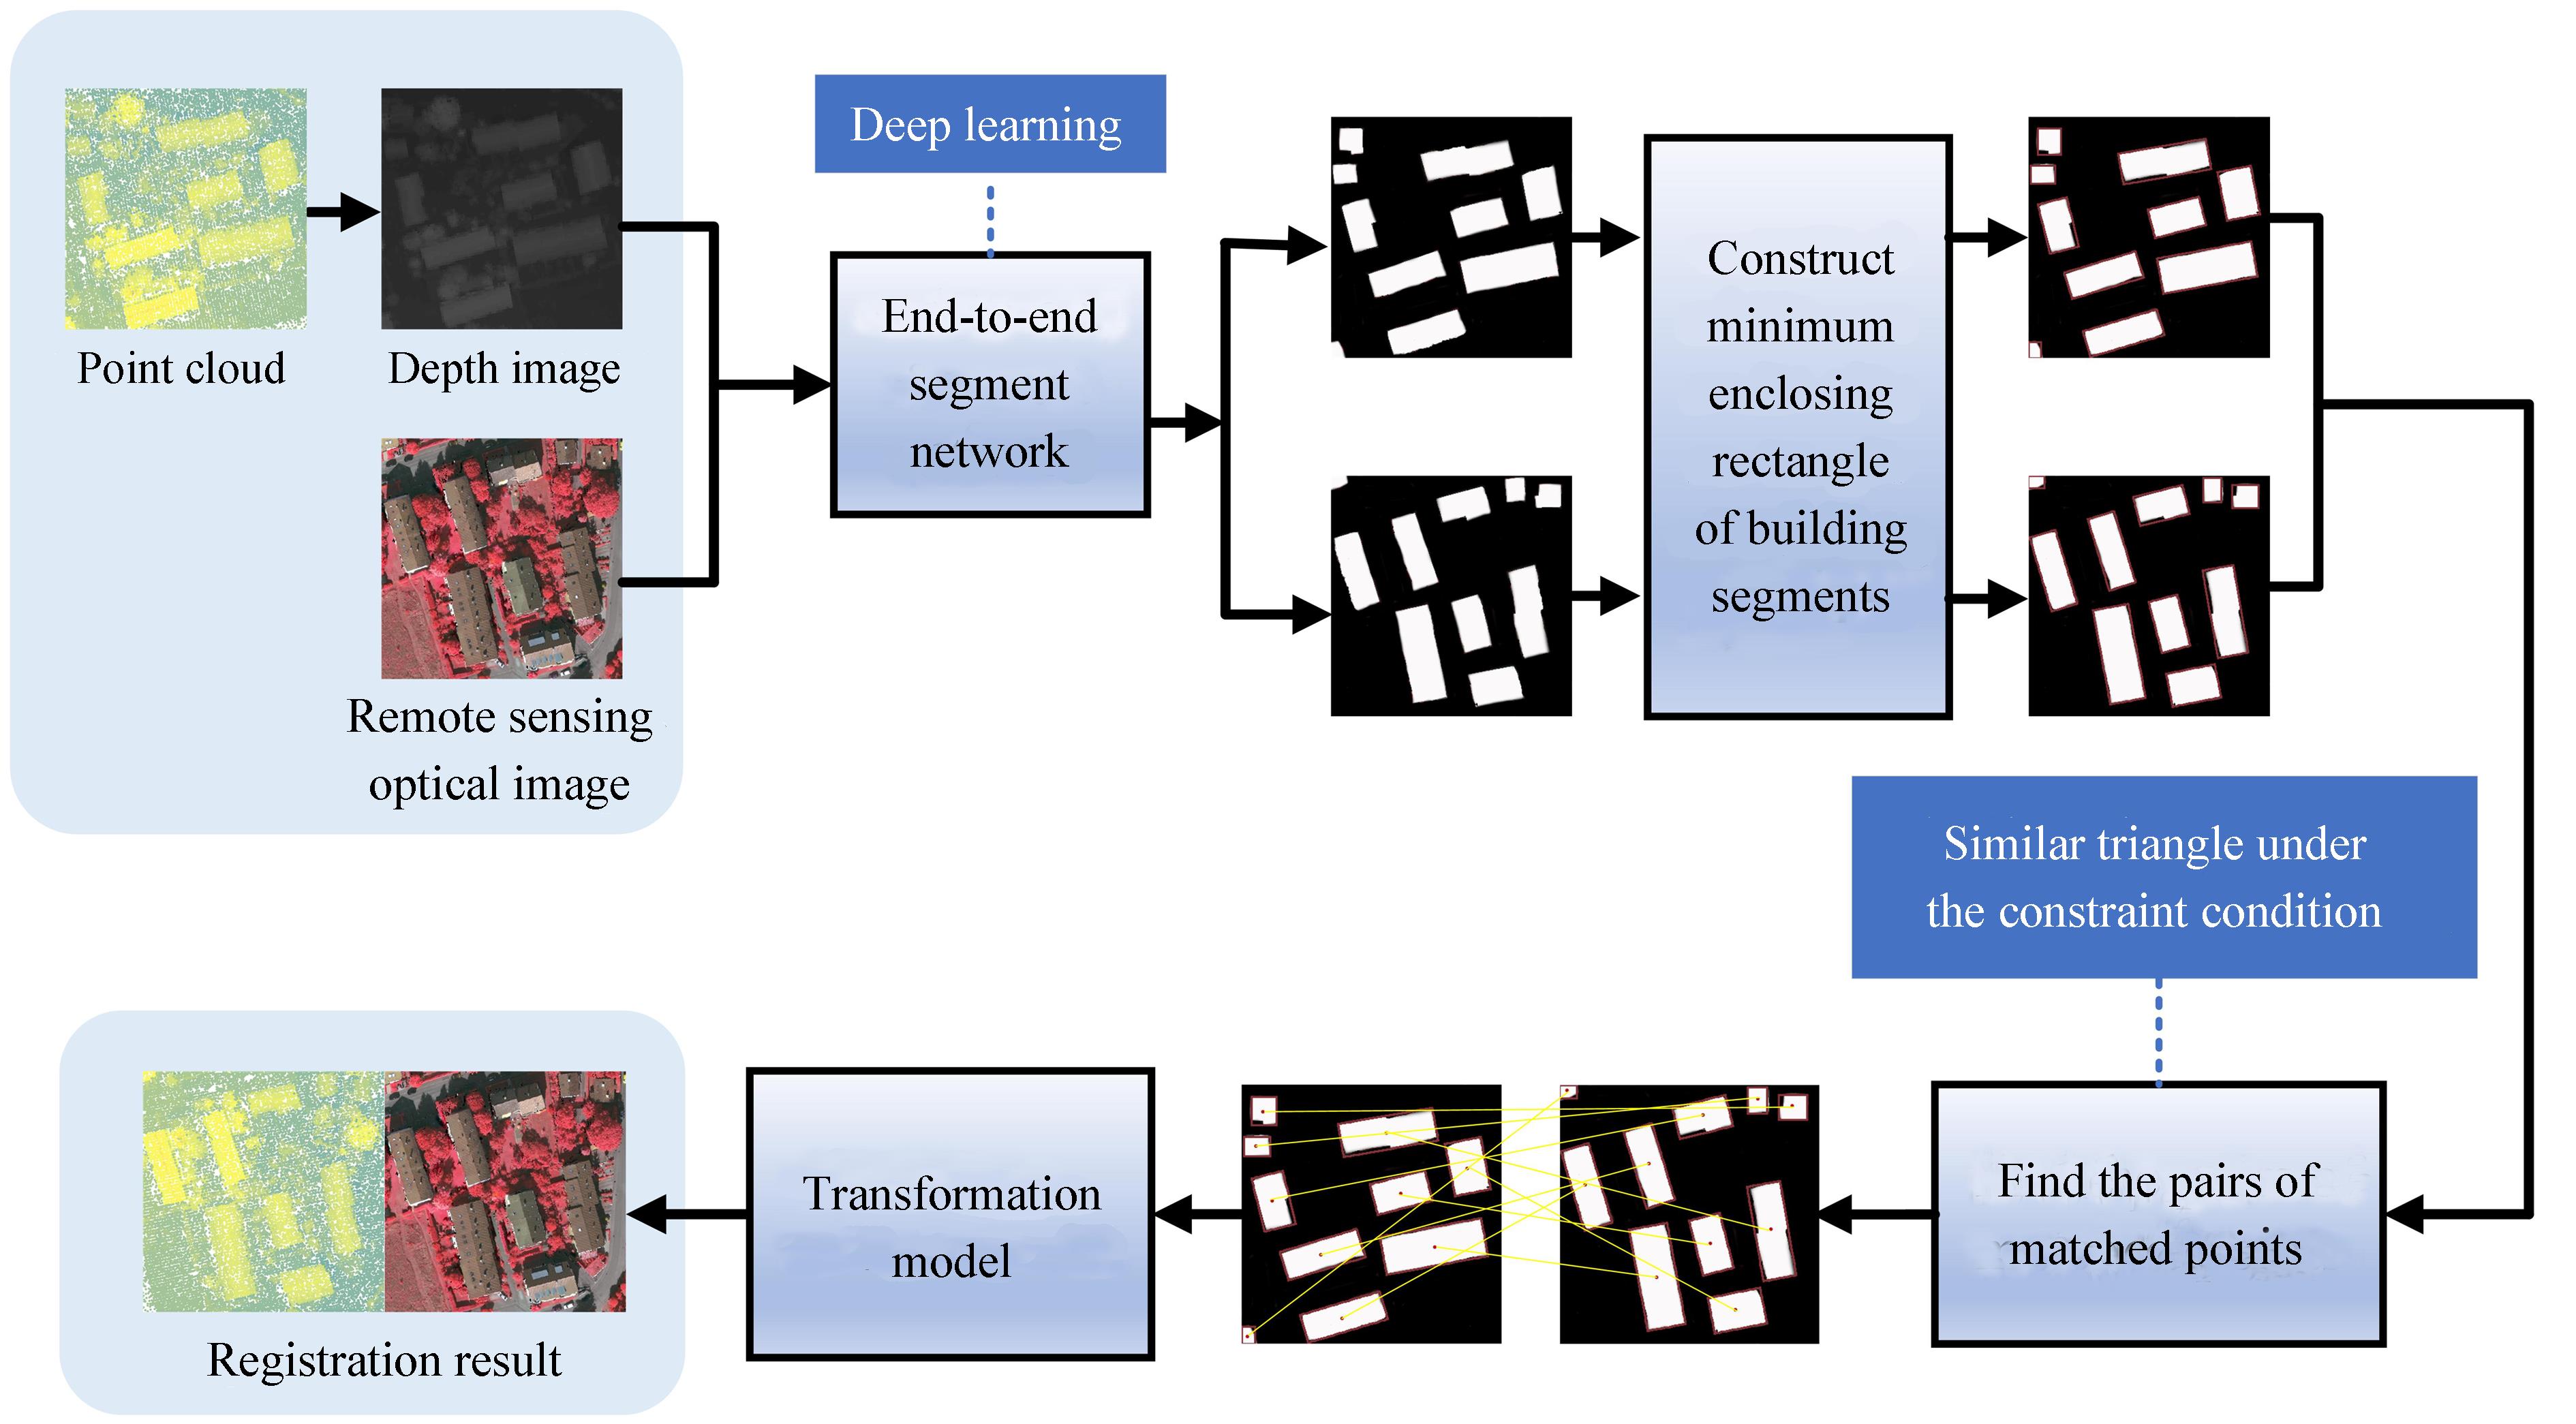
Fig. 1. Flow diagram
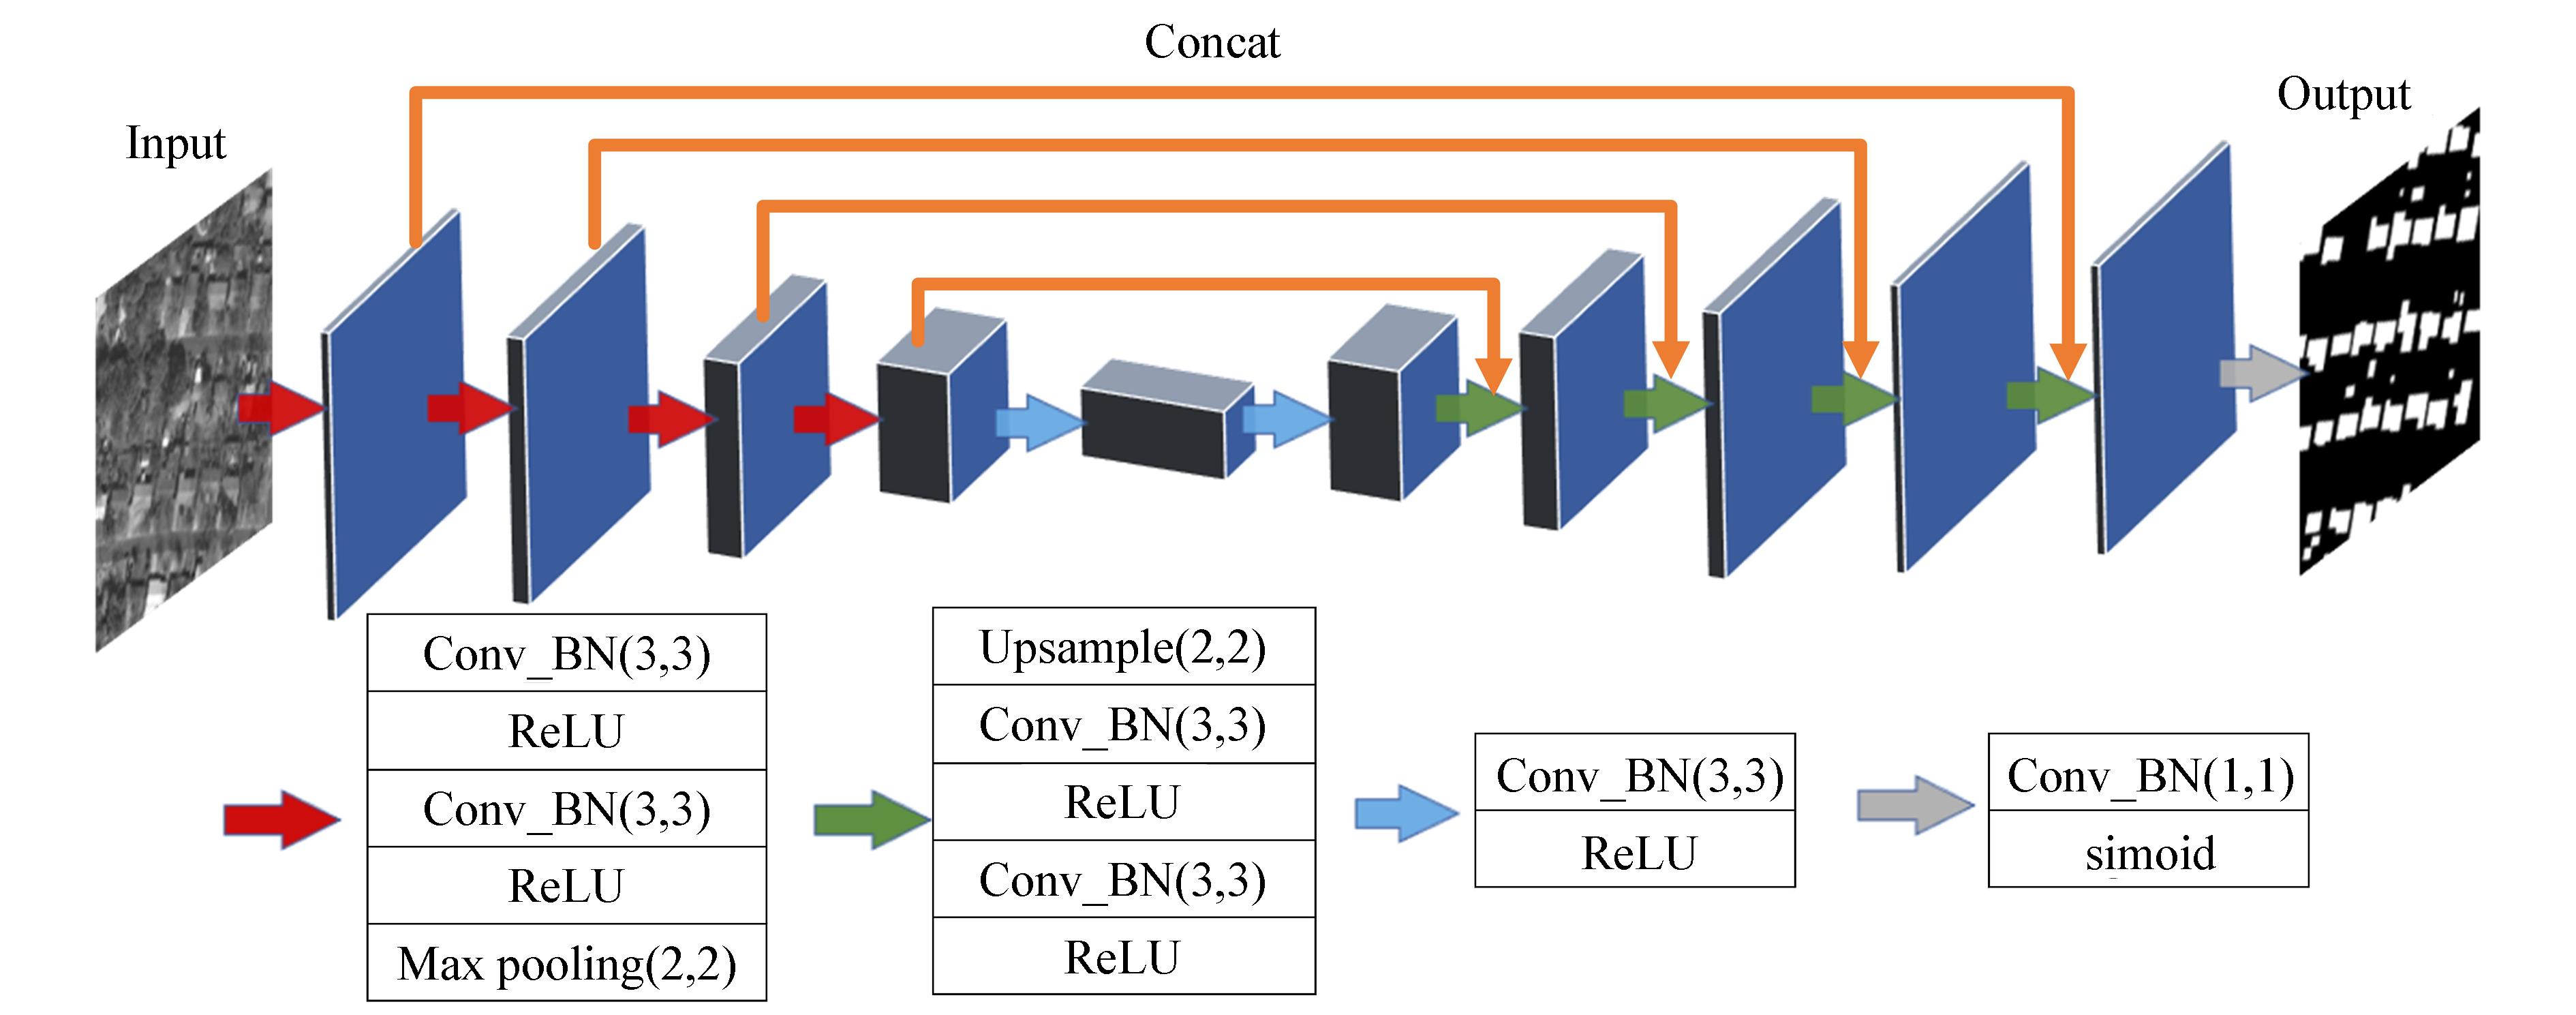
Fig. 2. Construction of Unet
Fig. 3. The segmentation results of UNET model for different kind image
Fig. 4. The outline of buildings(blue) and the minimum enclosing rectangle(red) from the segmentation result
Fig. 5. Find the pairs of matched points
Fig. 6. The depth image
Fig. 7. The first comparative experiment of optical image segmentation results between traditional segmentation method and deep learning method
Fig. 8. The second comparative experiment of optical image segmentation results between traditional segmentation method and deep learning method
Fig. 9. The first group of comparative experiments of point cloud segmentation results between traditional segmentation method and deep learning method
Fig. 10. The second group of comparative experiments of point cloud segmentation results between traditional segmentation method and deep learning method
Fig. 11. The first group of test data
Fig. 12. The second group of test data
Fig. 13. The third group of test data
Fig. 14. Point matching result
Fig. 15. Registration result
Fig. 16. Intermediate process diagram of the Method II
|
Table 1. Segmentation index data
| ||||||||||||||||||||||||||||||||||||||||||||||||||||||||||||||||||||
Table 2. Registration accuracy(uint:pixel)
| ||||||||||||||||||||||||||||||||||||||||||||||||||||||||||||||||||||||||||||||||||||||||||||||||||||||||||||||||||||||||||||||||||||||||||||||||||||||||||||||||||||||||||||||||||||||||||
Table 3. The matching of feature points of method II, method III and our method. And the root mean square error of four registration methods

Set citation alerts for the article
Please enter your email address
© Copyright 2018-2021 | Chinese Laser Press. All Rights Reserved 沪ICP备15018463号-20