• Advanced Photonics Nexus
  • Vol. 3, Issue 3, 036004 (2024)
Jiajun Ma1, Chunmei Ouyang1、*, Yuting Yang2、*, Xinyue Qian2, Li Niu1, Yi Liu1, Quan Xu1, Yanfeng Li1, Zhen Tian1, Jianqiang Gu1, Jiaguang Han1、3, and Weili Zhang4、*
Author Affiliations
  • 1Tianjin University, Center for Terahertz Waves and College of Precision Instrument and Optoelectronics Engineering, and Key Laboratory of Optoelectronics Information and Technology, Tianjin, China
  • 2China University of Mining and Technology, School of Materials Science and Physics, Xuzhou, China
  • 3Guilin University of Electronic Technology, Guangxi Key Laboratory of Optoelectronic Information Processing, School of Optoelectronic Engineering, Guilin, China
  • 4Oklahoma State University, School of Electrical and Computer Engineering, Stillwater, Oklahoma, United States
  • show less
    DOI: 10.1117/1.APN.3.3.036004 Cite this Article Set citation alerts
    Jiajun Ma, Chunmei Ouyang, Yuting Yang, Xinyue Qian, Li Niu, Yi Liu, Quan Xu, Yanfeng Li, Zhen Tian, Jianqiang Gu, Jiaguang Han, Weili Zhang. Frequency-dependent selectively oriented edge state topological transport[J]. Advanced Photonics Nexus, 2024, 3(3): 036004 Copy Citation Text show less
    Schematic of the FSDT topological photonic device, which has the intriguing frequency multiplexing feature that edge states of different frequencies selectively transport in different edge channels.
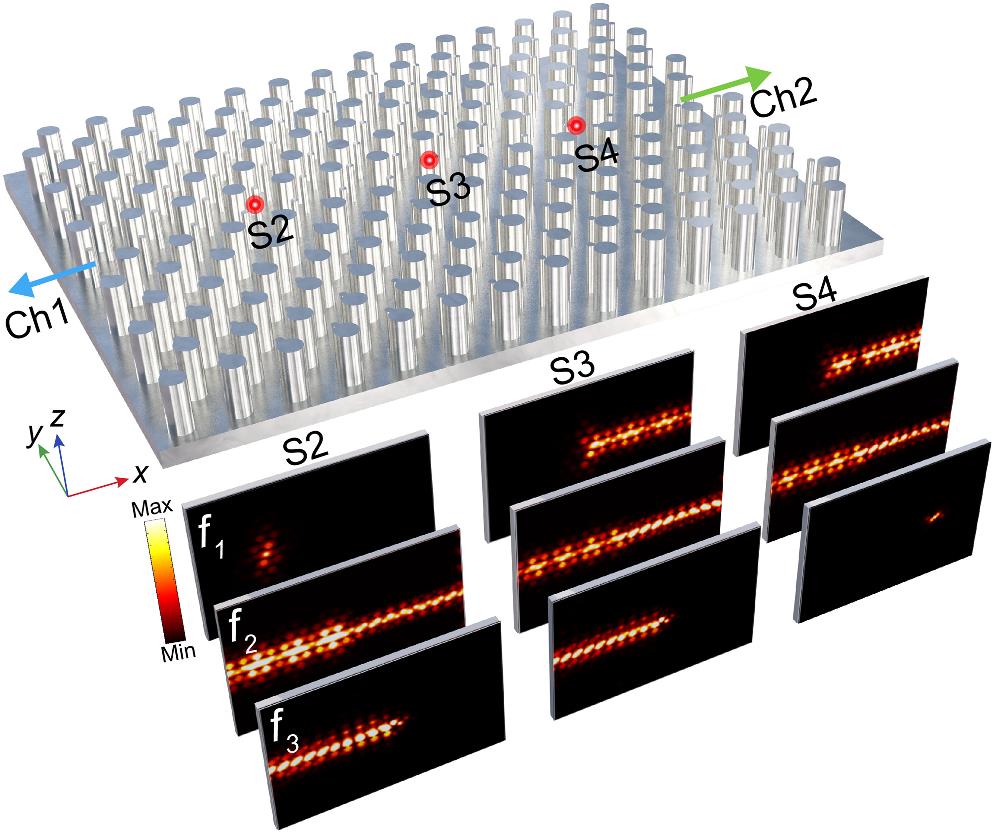
    Fig. 1. Schematic of the FSDT topological photonic device, which has the intriguing frequency multiplexing feature that edge states of different frequencies selectively transport in different edge channels.
    Broadband spoof SPP valley TPCs. (a) Schematic illustration of the designed TPC structure composed of VPCs with inverted symmetry, where the rhomboidal unit cell consists of inequivalent metallic rods with different radii and heights on top of a metal surface. The green line denotes the zigzag-shaped domain wall. (b) Band diagram of the VPCs with and without inversion symmetry, where the blue, red, and black lines represent the dispersions of the VPCs with inversion symmetry, without inversion symmetry, and the light line in air, respectively. The light-yellow region corresponds to the common PBG of the VPCs. Left inset: first Brillouin zone of the VPCs. (c) Simulated eigenmode profiles at K and K′ valleys for the first and second bands of the VPCs in the x-y plane. The color scale shows the magnitude of the z-oriented electric field Ez, while the black cones represent the Poynting power flows. (d) Projected dispersion of the valley topological edge states (red lines) for the zigzag-shaped domain wall. The light red, blue, and gray shadow areas represent the edge states and PBGs (PBG1 and PBG2).
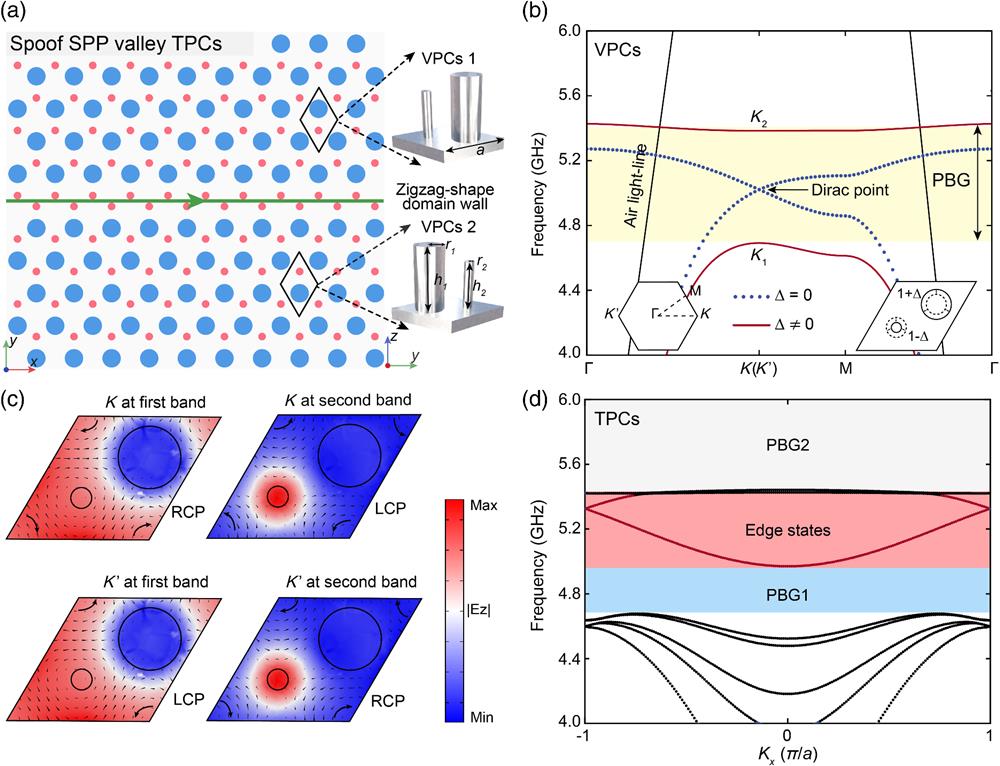
    Fig. 2. Broadband spoof SPP valley TPCs. (a) Schematic illustration of the designed TPC structure composed of VPCs with inverted symmetry, where the rhomboidal unit cell consists of inequivalent metallic rods with different radii and heights on top of a metal surface. The green line denotes the zigzag-shaped domain wall. (b) Band diagram of the VPCs with and without inversion symmetry, where the blue, red, and black lines represent the dispersions of the VPCs with inversion symmetry, without inversion symmetry, and the light line in air, respectively. The light-yellow region corresponds to the common PBG of the VPCs. Left inset: first Brillouin zone of the VPCs. (c) Simulated eigenmode profiles at K and K valleys for the first and second bands of the VPCs in the x-y plane. The color scale shows the magnitude of the z-oriented electric field Ez, while the black cones represent the Poynting power flows. (d) Projected dispersion of the valley topological edge states (red lines) for the zigzag-shaped domain wall. The light red, blue, and gray shadow areas represent the edge states and PBGs (PBG1 and PBG2).
    Valley topological edge states and PBGs. (a) and (b) Evolution of the working bandwidths of the VPC-PBG, TPC-edge states, and TPC-PBG1 with respect to the perturbations of height difference Δh and radius difference Δr, respectively. The threshold values of changing the height difference Δh and radius difference Δr to open PBG1 are Th=0.58 mm and Tr=0.82 mm, respectively. (c) Simulated transmission spectrum of the straight spoof SPP valley TPC waveguide. The light red, blue, and gray shadow regions correspond to the edge states, PBG1, and PBG2, respectively. (d) Simulated |Ez| field distributions of the valley topological edge states in the x-y, x-z, and y-z planes at 5.20 GHz.
    Fig. 3. Valley topological edge states and PBGs. (a) and (b) Evolution of the working bandwidths of the VPC-PBG, TPC-edge states, and TPC-PBG1 with respect to the perturbations of height difference Δh and radius difference Δr, respectively. The threshold values of changing the height difference Δh and radius difference Δr to open PBG1 are Th=0.58  mm and Tr=0.82  mm, respectively. (c) Simulated transmission spectrum of the straight spoof SPP valley TPC waveguide. The light red, blue, and gray shadow regions correspond to the edge states, PBG1, and PBG2, respectively. (d) Simulated |Ez| field distributions of the valley topological edge states in the x-y, x-z, and y-z planes at 5.20 GHz.
    Concept of the broadband FSDT topological photonic device. (a) Design strategy of the FSDT device composed of two valley TPCs with different heights h, TPC I (blue area), and TPC II (red area). The light-red, yellow, and blue regions represent the LF, IF, and HF waves, respectively. The arrows indicate the propagation directions of the edge states. (b) Schematic of the FSDT device shows versatility when the source is located at different locations. The black dashed line denotes the position of the zigzag-shaped domain wall. (c) and (d) Dispersion curves of the ribbon-shaped supercells of TPC I and TPC II, respectively. The blue and red lines are dispersion curves for the edge states of TPC I and TPC II, respectively. The frequency ranges of the valley topological edge states of TPC I and TPC II are HF + IF (light blue + yellow regions) and IF + LF (light yellow + red regions), respectively. The black dotted lines are in the bulk bands and the PBGs are indicated by the gray regions.
    Fig. 4. Concept of the broadband FSDT topological photonic device. (a) Design strategy of the FSDT device composed of two valley TPCs with different heights h, TPC I (blue area), and TPC II (red area). The light-red, yellow, and blue regions represent the LF, IF, and HF waves, respectively. The arrows indicate the propagation directions of the edge states. (b) Schematic of the FSDT device shows versatility when the source is located at different locations. The black dashed line denotes the position of the zigzag-shaped domain wall. (c) and (d) Dispersion curves of the ribbon-shaped supercells of TPC I and TPC II, respectively. The blue and red lines are dispersion curves for the edge states of TPC I and TPC II, respectively. The frequency ranges of the valley topological edge states of TPC I and TPC II are HF + IF (light blue + yellow regions) and IF + LF (light yellow + red regions), respectively. The black dotted lines are in the bulk bands and the PBGs are indicated by the gray regions.
    Experimental observation of the broadband FSDT device. (a) Photograph of the experimental sample of the topological photonic device, which is composed of TPC I and TPC II. The blue and red lines represent the positions of the domain walls of TPC I and TPC II, respectively. (b)–(d) Experimentally recorded transmission spectra (in dB) at ports S1 and S5 when the source is placed at ports S3, S2, and S4, respectively. The transmission spectrum corresponding to port 1 is shown as the solid blue line, while that for port 5 is shown as the solid red line. The insets on the right in each figure are the experimental Ez field distributions of the edge states at 4.88, 5.13, and 5.44 GHz (from top to bottom).
    Fig. 5. Experimental observation of the broadband FSDT device. (a) Photograph of the experimental sample of the topological photonic device, which is composed of TPC I and TPC II. The blue and red lines represent the positions of the domain walls of TPC I and TPC II, respectively. (b)–(d) Experimentally recorded transmission spectra (in dB) at ports S1 and S5 when the source is placed at ports S3, S2, and S4, respectively. The transmission spectrum corresponding to port 1 is shown as the solid blue line, while that for port 5 is shown as the solid red line. The insets on the right in each figure are the experimental Ez field distributions of the edge states at 4.88, 5.13, and 5.44 GHz (from top to bottom).
    Jiajun Ma, Chunmei Ouyang, Yuting Yang, Xinyue Qian, Li Niu, Yi Liu, Quan Xu, Yanfeng Li, Zhen Tian, Jianqiang Gu, Jiaguang Han, Weili Zhang. Frequency-dependent selectively oriented edge state topological transport[J]. Advanced Photonics Nexus, 2024, 3(3): 036004
    Download Citation