1State Key Laboratory of Transient Optics and Photonics, Xi’an Institute of Optics and Precision Mechanics, Chinese Academy of Sciences, Xi’an 710119, China
2Engineering and Surface Metrology Laboratory, National Institute of Standards, Tersa St., El haram, El Giza, Egypt
3Division of Mechanical System Engineering, Chonbuk National University, Jeonju 561-756, Republic of Korea
D. G. Abdelsalam, Junwei Min, Daesuk Kim, Baoli Yao. Digital holographic shape measurement using Fizeau microscopy[J]. Chinese Optics Letters, 2015, 13(10): 100701
Copy Citation Text
We present a Fizeau interferometer using a microscopic objective as a tool for surface contouring without the need for a numerical lens for reconstruction. The interferometer is associated with a telescope system to feature the object with collimated light. The experiment is conducted on two objects possessing different step heights. The phase maps from the captured off-axis holograms are calculated numerically, which allows us to deduce the contours of the objects. The great advantages of the presented technique are that it can be done in real time and there is no need for numerical lenses for micro-objects reconstruction.
Optical surfaces can be accurately measured by interfering light reflected from the surface under testing with light reflected from a known reference surface. The resulting interference pattern is analyzed to determine the contour of the optical surface. Fizeau interferometers[1–4] are most commonly used for the testing of the surface figure, flatness, parallelism, homogeneity, etc., of optical components. Fizeau interferometers are not exactly common path interferometers, but the interfering beams travel along nearly identical paths, and the gap between the reference surface and the specimen surface is small. Thus, it offers numerous advantages over the configuration of non-common path interferometry, such as Twyman–Green interferometry[5–7], and can provide excellent stability for a real-time measurement even with mechanical vibrations caused by an environmental chamber[8]. A mathematical analysis for multiple-beam interference in Fizeau interferometry was first proposed by Brossel[9]. More detailed analyses have followed to understand the intensity distribution of the multiple-beam interference produced by a Fizeau interferometer[10–12]. For the contouring of surfaces that have small irregularities, a microscopic objective (MO) with high magnification is required. Although the MO can magnify the details of a specimen, an inherent wavefront curvature is introduced by it during recording, and a numerical lens (conjugate digital lens) must be simulated and multiplied to compensate for it. However, this method is tedious and time consuming because it requires four unknown factors to be numerically solved[13]. Alternatively, another lens with the same specifications as that of the objective lens can be positioned in the reference arm to compensate for the phase. The main drawback of this method in terms of cost and careful adjustment is the requirement of two identical microscope objectives to compensate for the phase. In this Letter, we practically achieve a microscopic hologram using only one MO. The idea is based on using a telescope-like system to produce an expanded collimated beam without any wavefront curvature. The telescope-like system components are a MO and tube lenses. The focal lengths of both the MO and tube lenses have been chosen carefully to match the beam size that illuminates the sample. The collimation of the telescope-like system is adjusted carefully by using a shearing interferometer as an indicator.
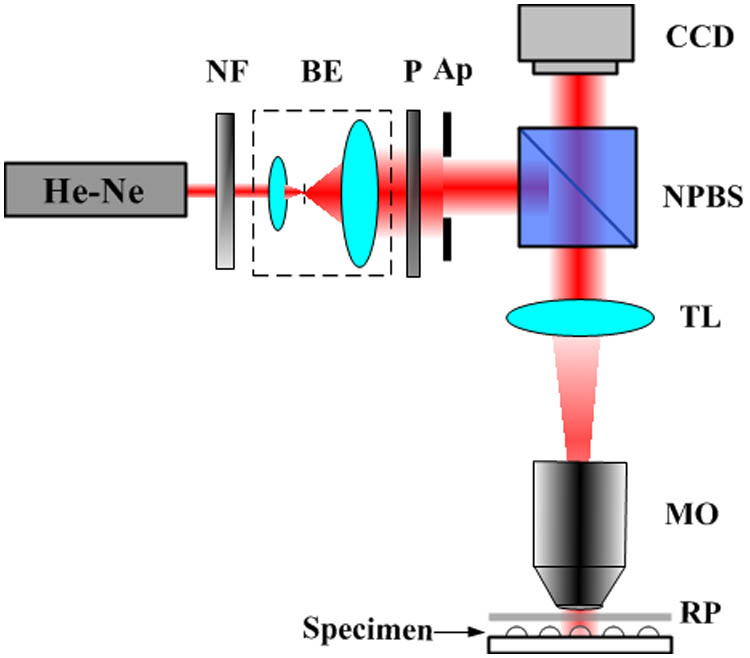
Figure 1 illustrates the experimental setup of the Fizeau interferometer for the measurement of the surface height. Light from a linearly polarized He–Ne (632.8 nm) laser source is allowed to pass through a spatial filtering arrangement consisting of a MO and an appropriate pinhole placed at the front focal point of the MO to produce an expanded beam. This expansion is necessary to reduce the error in the measurement due to the inhomogeneity in the Gaussian beam. An adjustable aperture is used to ensure that the illuminated light is just filled with the exit pupil of the objective and to reduce stray light. The collimated beam of the laser light fell upon the beam splitter, which divides the beam into two copies. The reflected copy of the light is incident on the Fizeau interferometer through the telescope system. The Fizeau interferometer cavity is formed between the coated front surface () (the surface adjacent to the test surface) of a high-quality optical plate, which is 50.80 mm in size and has a flatness value, and the tested object surface (). The reference plate is wedged so that the beams reflected from the reference and the test surfaces interfere to form the interference pattern. A CCD camera of with a pixel size of 3.45 μm and a capturing frame rate 15 frames/s is used to capture the off-axis hologram of the object. The phase and intensity of the hologram were numerically retrieved by using the convolution method. Before the convolution method is applied, the zero-order term was eliminated[3,4].
Figure 1.Optical schematic of the Fizeau interferometer-based setup. NF, neutral filter; BE, beam expander; P, polarizer; Ap, aperture; NPBS, non-polarizing beam splitter; TL, tube lens; RP, reference plate.
Figure 2 shows the ingoing and outgoing beams incident on the Fizeau cavity. As shown from Fig. 2(a), the interference pattern produced from the reflected beams of the reference and the object surfaces can hardly be seen because the non-collimation beams interfered due to the presence of the MO. The collimation is achieved by using a tube lens with a chosen focal length, as shown in Fig. 2(b). The perfect collimation that produced a perfect plane wave impinging on the reference was adjusted by a shearing interferometer. Here, non-collimated beam means that when the object is being focused, the reference is out of focus and vice versa due to the spherical waves generated by the MO. Solving this problem requires a MO with a long focal length and depth of focus, which is limited and hardly available. This means one can attain a MO that possesses a depth of focus greater than the thickness of the reference and the gap between the reference and the object, i.e., the depth of focus is greater than (). Figure 2(b) shows that the in-focus and out-of-focus problems can be solved by using a telescope-like system to collimate the beam. The collimation means that the ingoing and outgoing beams from the interferometer are parallel. In this case, an object possessing very small irregularities can be imaged and reconstructed numerically. The reference of the interferometer is a high-quality optical flat of 50.80 mm in size and that possesses a flatness value of . Objects possessing step heights of 485 and 242 nm were mounted in the interferometer individually. Both the reference and the object are wedged so that the beams reflected from the reference and the test surfaces interfere to form the interference pattern. The phases and intensities of the off-axis holograms were numerically retrieved by using the convolution-based Fresnel method.
Sign up for Chinese Optics Letters TOC. Get the latest issue of Chinese Optics Letters delivered right to you!Sign up now
Figure 2.Optical schematic of the Fizeau cavity. (a) Non-collimated beam due to the presence of the MO. (b) Collimated beam using a telescope-like system.
The interferogram (or digital hologram) intensity resulting from the interference of the object wave and the reference wave recorded by the CCD camera is given by: where is the interferogram (or digital hologram) intensity, and and are integers. In Eq. (1), stands for the complex conjugate: the first two intensity terms are of the zero order, which can be directly filtered in the Fourier domain[14–20], and the last two terms represent the interference terms with the object wave (the virtual images), or its conjugate (the real images), which are being modulated by the spatial carrier frequency in the spatial frequency domain. After filtering out the object and conjugate terms by a spatial filtering approach[17], the filtered spectrum data in the spatial frequency domain can be turned back into the spatial domain by using an inverse two-dimensional (2D) fast Fourier transform. For off-axis digital holography, the propagation of the filtered complex wave is calculated numerically, while a Fresnel transform-based propagation step is not necessary for interferometry. Let us define the filtered complex wave as
The above filtered complex wave is an array of complex numbers. An amplitude-contrast image and a phase-contrast image can be obtained by using the intensity [] and the argument arctan [], respectively. Finally, in order to obtain the object information, needs to be multiplied by a digital reference wave . Here, and are integers. If we assume that a perfect plane wave is used as a reference for interferogram recording, the computed replica of the reference wave can be represented as where is the amplitude, and and are the two components of the wave vector that must be adjusted such that the propagation direction of is matched as closely as possible with that of the experimental reference wave. By using this digital reference wave concept, we can obtain an object wave, which is reconstructed in the central region of the observation plane. The reconstructed complex wavefront is reconstructed from the off-axis interferogram and then converted to height. The reconstruction process was performed by selecting the appropriate values for two components of the wave vector, and . The reconstructed phase for the appropriate values of and was improved by using the apodization technique, and the height variation is given as where is the improved phase by apodization and is the wavelength of the He–Ne laser source. The experiment was conducted on two objects possessing different step heights. The step height of the first object is 485 nm, and the step height of the second object is 242 nm. The first object was tested using a telescope comprised of a MO (, NA 0.075, ) and a collimating lens L (), giving a magnification of . The second object was tested using a telescope comprised of a MO (, NA 0.55, ) and a collimating lens L (), giving a magnification of . Both the reference and the object are wedged so that the beams reflected from the reference and the test surfaces interfere to form the interference pattern. The off-axis holograms of the two objects captured by the CCD camera are shown in Fig. 3.
Figure 3.Off-axis holograms of (a) the object possessing a step height of 485 nm and (b) another object possessing a step height of 242 nm. The bad quality of the off-axis hologram of (a) may be come from the homemade manufacturing sample (non-standard).
The off-axis interferograms have been numerically processed individually to obtain the object waves, and both the amplitudes and phases of the two objects can be obtained. The digital reference wave used in the calculation process should be matched as close as possible to the experimental reference wave. This has been done in this Letter by selecting the appropriate values of two components of the wave vector. In our experiment, and for the off-axis hologram shown in Fig. 3(a), and and for the off-axis hologram shown in Fig. 3(b). Once the two-phase maps are obtained for each off-axis hologram, a 2D surface profile with height can be calculated directly by Eq. (4). The reconstructed phase of Fig. 3(a) is shown in Fig. 4(a). The reconstructed phase is noisy, so an apodization method[19,20] has been applied to reduce the noise in the phase contrast image. Apodization is the same as windowing in signal processing. Figure 4(b) shows the correction of Fig. 4(a) with apodization. The noise has been reduced drastically.
Figure 4.Reconstructed phase (radians) maps from the off-axis hologram of Fig. 3(a). Reconstruction (a) before and (b) after correction with the apodization method.
A profile of the 2D function representing the transmission of the apodized aperture function is presented in Fig. 5. The aperture is completely transparent (transmission equal to unity) in the large central part of the profile. At the edges, the transmission varies from zero to unity following a curve defined by a cubic spline interpolation. Figure 5(b) shows the reconstructed amplitude contrast image of Fig. 3(a) after the application of the apodized aperture technique for the same values of and .
Figure 5.Transmission profile of the apodized aperture. (a) The transmission from 0 to 1 at the edge of the aperture follows a cubic spline interpolation; the dashed line indicates the transmission of the unapodized aperture. (b) Numerically reconstructed amplitude contrast image in Fig. 5(b) after using the apodized aperture.
A cut line on the 2D surface phase of Fig. 4(b) is extracted and shown in Fig. 6; it has 282 pixels in the direction. Based on the measured phase in Fig. 6, the average step height has been estimated by using Eq. (4) to be around 500 nm ().
Figure 6.Phase profile along the direction of Fig. 4(b).
Figure 7(a) shows the reconstructed phase of the off-axis hologram shown in Fig. 3(b). The reconstructed phase using the apodization aperture technique with the same transmission function shown in Fig. 5(a) is shown in Fig. 7(b) for the same values of and .
Figure 7.Reconstructed phase (radians) maps from the off-axis hologram of Fig. 3(b). (a) Reconstruction before correction with the apodization method. (b) Reconstruction after correction with the apodization technique at the same values of and .
It is worth mentioning that in holographic microscopy, image focusing occurs when the reconstruction distance is equal to the distance between the CCD and the image during hologram recording. The experimental results of Fig. 7 show that reconstruction using the convolution Fresnel method may be not appropriate for small reconstruction distances, so we reconstructed the same hologram by using the angular spectrum method[21], and the results were refined as shown in Fig. 8.
Figure 8.Reconstruction of Fig. 3(b) by using the angular spectrum method. (a) Phase (radians) contrast image. (b) Amplitude contrast image.
A cut line on the 2D surface phase of Fig. 8(a) is extracted and shown in Fig. 9, which has 275 pixels in the direction. Based on the measured phase in Fig. 9, the average step height has been estimated by using Eq. (4) to be around 250 nm ().
Figure 9.Phase profile along the direction of Fig. 8(a).
The experimental results shown in Figs. 6 and 9 demonstrate that the uncertainty in the measurement was estimated to be of the order of 15 nm (the standard deviation was calculated for both profiles in Figs. 6 and 9).
In conclusion, we present a Fizeau interferometer using a MO as a tool for surface contouring. Thanks to a telescope system, we can convert the non-collimated beam into a collimated beam, and the conjugate digital lens is no longer necessary. The great advantages of the proposed method are that it can be done in real time and there is no need to reconstruct the microscopic objects with a numerical lens. We claim that the proposed technique can provide a simple, real-time solution for measuring microscopic objects without simulating a numerical lens, which in turn takes time to be solved numerically. To obtain a clear reconstructed phase image (no background fringes as shown in Fig. 7, for instance), we need to minimize the strongly scattered light, which mainly comes from the long coherent length of the He–Ne laser light. Using short coherent length sources such as femtosecond pulse light may reduce the scattered light to some amount, and this will be the next step of our research work.
D. G. Abdelsalam, Junwei Min, Daesuk Kim, Baoli Yao. Digital holographic shape measurement using Fizeau microscopy[J]. Chinese Optics Letters, 2015, 13(10): 100701