
Qingfang Wang, Zeyun Wang, Chao Han, Zhengyun Feng, Yufan Hao, Xu Wu, Yan Peng. Quantitative Detection of Biological Mixtures Based on Terahertz Metamaterial Chip[J]. Chinese Journal of Lasers, 2021, 48(23): 2314001
- Chinese Journal of Lasers
- Vol. 48, Issue 23, 2314001 (2021)
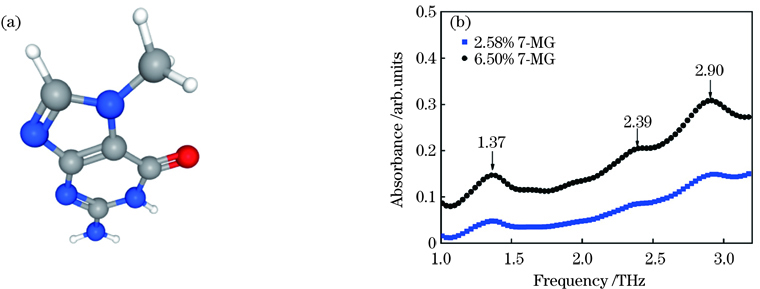
Fig. 1. 7-methylguanine. (a) Molecular structure; (b) THz characteristic spectra (gray, white, red, and blue represent the C, H, O, and N atoms, respectively)

Fig. 2. Unit structure diagram of resonant ring
Fig. 3. Terahertz resonance ring chip parameters. (a) Schematic diagram of chip testing principle device; (b) microscopic photographs of partial structure of metamaterial chip (200×); (c) terahertz spectrum of this chip
Fig. 4. Spectral tests with different concentrations.(a) Spectra of superstructures covered by different amounts of 7-methylguanine; (b) dependence of resonance peak shifting on the amount of 7-methylguanine
Fig. 5. Spectral tests at different concentrations. (a) Spectra of superstructures covered by different amounts of guanine; (b) dependence of resonance peak shifting on the amount of guanine
Fig. 6. THz spectra of binary mixture. (a) Spectra of the metamaterial chip covered by the binary mixture with different mixing ratios (G∶7-MG); (b) relationship between the total frequency shift of the binary mixture and individual frequency shift from the components in the binary mixture
Fig. 7. Terahertz spectra of the mixture before and after mixing with 7-MG. (a) Spectra of the metamaterial chip covered by the multicomponent mixture before and after the addition of 23.35 μg 7-MG; (b) relationship between the total frequency shift and individual frequency shift in a multicomponent mixture
|
Table 1. Guanine and 7-MG with different mixing ratios
|
Table 2. Adenine(A), G, thymine(T) cytosine(C), and 7-MG with different mixing ratios
|
Table 3. Comparison of 7-MG mass between the experimental and theoretical results and the corresponding relative error

Set citation alerts for the article
Please enter your email address
© Copyright 2018-2021 | Chinese Laser Press. All Rights Reserved 沪ICP备15018463号-20