
Yong Chen, Wei Zhang. Dynamic model of high speed following traffic flow [J]. Acta Physica Sinica, 2020, 69(6): 064501-1
- Acta Physica Sinica
- Vol. 69, Issue 6, 064501-1 (2020)
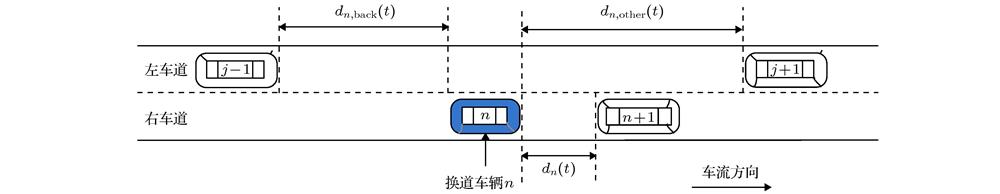
Fig. 1. Diagram of spatial relations of lane-changing vehicles.
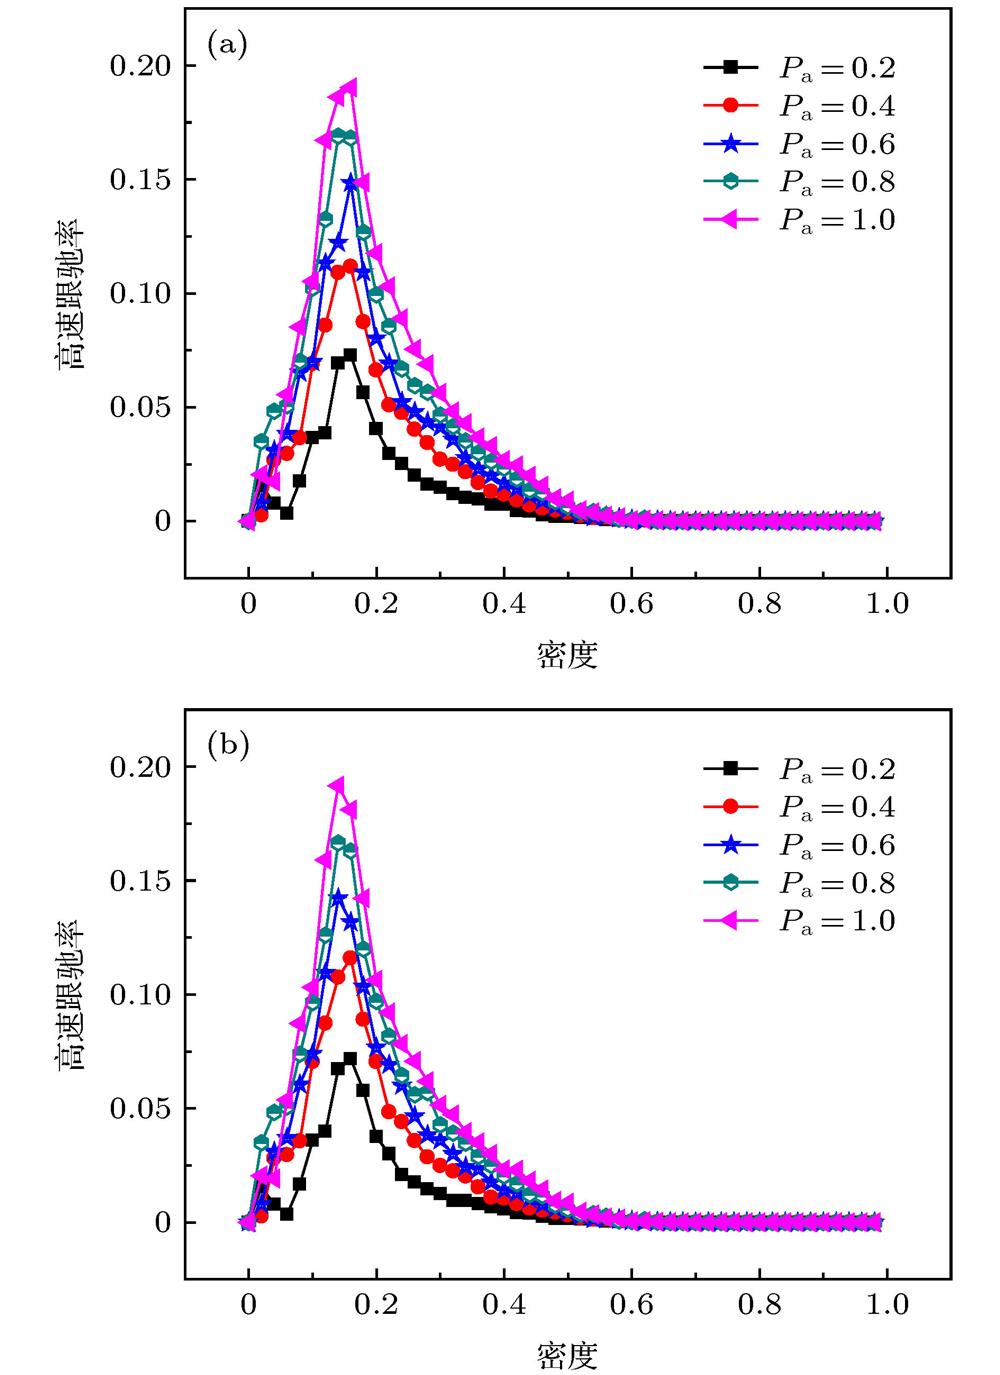
Fig. 2. Rate of high speed car-following and denisty relationship diagram under the different probability of aggressive drivers: (a) Rate of high speed car-following in left lane; (b) rate of high speed car-following in right lane.
Fig. 3. Space-time diagrams of different lanes under the condition of ρ 1 = 0.2 and ρ 2 = 0.1: (a) Left lane evolution with STCA rules; (b) right lane evolution with STCA rules; (c) left lane evolution with HCCA rules; (d) right lane evolution with HCCA rules.
Fig. 4. Space-time diagrams of different lanes under the condition of ρ 1 = 0.3 and ρ 2 = 0.1: (a) Left lane evolution with STCA rules; (b) right lane evolution with STCA rules; (c) left lane evolution with HCCA rules; (d) right lane evolution with HCCA rules.
Fig. 5. Space-time diagrams of different lanes under the condition of ρ 1 = 0.3 and ρ 2 = 0.2: (a) Left lane evolution with STCA rules; (b) right lane evolution with STCA rules; (c) left lane evolution with HCCA rules; (d) right lane evolution with HCCA rules.
Fig. 6. Velocity distribution diagram of different lanes under the condition of ρ 1 = 0.08 and ρ 2 = 0.08: (a) Left lane evolution with STCA rules; (b) right lane evolution with STCA rules; (c) left lane evolution with HCCA rules; (d) right lane evolution with HCCA rules.
Fig. 7. Velocity distribution diagram of different lanes under the condition of ρ 1 = 0.14 and ρ 2 = 0.14: (a) Left lane evolution with STCA rules; (b) right lane evolution with STCA rules; (c) left lane evolution with HCCA rules; (d) right lane evolution with HCCA rules.
Fig. 8. Density and flow relationship diagram under the mixing probability of different type drivers: (a) Density and flow relationship in left lane; (b) density and flow relationship in right lane.
|
Table 1.
Comparison of calculation errors of different velocity-denisty models.
不同速度密度关系计算的误差比较

Set citation alerts for the article
Please enter your email address
© Copyright 2018-2021 | Chinese Laser Press. All Rights Reserved 沪ICP备15018463号-20