Abstract
The measurement of the second-order degree of coherence [] is one of the important methods used to study the dynamical evolution of photon-matter interaction systems. Here, we use a nitrogen-vacancy center in a diamond to compare the measurement of with two methods. One is the prototype measurement process with a tunable delay. The other is a start-stop process based on the time-to-amplitude conversion (TAC) and multichannel analyzer (MCA) system, which is usually applied to achieve efficient measurements. The divergence in the measurement results is observed when the delay time is comparable with the mean interval time between two neighboring detected photons. Moreover, a correction function is presented to correct the results from the TAC-MCA system to the genuine . Such a correction method will provide a way to study the dynamics in photonic systems for quantum information techniques.The second-order degree of coherence measurement [] based on the Hanbury, Brown, and Twiss (HBT) interferometer[1] has become a key method in quantum optics. The statistical properties of an optical field[2–4] and the number of single quantum emitters can be obtained from the value of the zero-delay second-order degree of coherence []. It has been successfully applied in the discovery of the photon antibunching effect[5] with , theoretically. Moreover, the indistinguishability-induced photon bunching effect in multiphoton interference and stimulated emission has been demonstrated in experiments[6] with . Such a measurement has been hotly applied in the measurement of the properties of single-photon emitters[7,8]. Based on the antibunching effect of the single-photon emitter, the quantum statistical image can achieve a resolution of several nanometers[9,10]. By measuring the delay-dependent , with , the dynamical process in the system can be measured well[11–13]. An ultrafast spectral diffusion process with a time resolution of subnanoseconds[14,15] has also been demonstrated.
In the experiments, an efficient method to measure is based on the start-stop process with time-to-amplitude conversion (TAC) and a multichannel analyzer (MCA) system, which can simultaneously detect the two-photon coincidence counts (C.C.). However, such a measurement process only counts partial photons and the output from the TAC-MCA system needs to be corrected when the delay time is comparable to the mean interval time between two neighboring detected photons. Here, we used a nitrogen-vacancy (NV) center in a diamond to demonstrate the divergence between the genuine from the prototype measurement process with a tunable electronic delay and the measurement results from the TAC-MCA system. The correction of the measurement results from the TAC-MCA system was also present. Such a correction should be applied to get accurate values to demonstrate the dynamical processes in different systems.
Theoretically, can be expressed as the normalized second-order correlation function where describes the single-photon number detected at time and is the second-order correlation function corresponding to the two-photon coincidence counts when the second photon is detected at the delay time after the first photon. In the experiment, in order to measure , photons emitted from the photon source are usually separated by a beam splitter (BS) and then detected by single-photon counting modules (SPCMs). The two single-photon counts from the two SPCMs are independent of time for a statistically stationary field. According to the definition of , the two-photon coincidence counts can be measured by introducing a tunable optical delay between the two SPCMs, or an electronic delay after one of the SPCMs, as shown in Fig. 1(a). Due to the method with optical or electronic delay only one delay time can be measured at a time, so it always takes a long time to obtain the whole . Such a prototype measurement process lacks efficiency and is seldom applied in practical experiments. In order to enhance the detection efficiency, the general method to measure is using the start-stop process with the TAC-MCA system [Fig. 1(b)]. It can simultaneously measure the two-photon coincidence counts with the delay time between 0 and the maximal time set by the TAC so this system is simple and takes less time to obtain the whole delay function with .
Sign up for Chinese Optics Letters TOC. Get the latest issue of Chinese Optics Letters delivered right to you!Sign up now

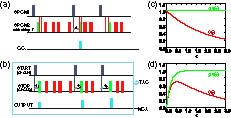
Figure 1.Schemes to measure based on prototype measurements with (a) a tunable electronic delay and (b) a start-stop process with a TAC-MCA system. (c) and (d) show the differences between and for the Poisson distribution (; ) and antibunched photons (; ).
In the experiment, the TAC measures the time interval between the start and stop input electronic pulses from the two SPCMs and generates an analog output pulse signal proportional to the measured time. Then the signal from the TAC is input to the MCA to measure the statistical distribution and give the measurement result according to the delay . However, the TAC will halt a measurement process when it receives a stop input electronic pulse from the second SPCM. In this case, the photons for which arrival times are still within after the detected one would be ignored. Therefore, the delay function demonstrates a conditional measurement of the photon with delay time in the case that no photon is detected before it. Such a measurement process produces errors and the photon statistics are invalid. Theoretically, can be expressed by counting the probabilities of all photons with the delay time in with the equations where the normalized with is the probability that the second photon is observed between and and . Such convolutions can be replaced by simple products with Laplace transforms. For a Poisson distribution and antibunched photons from a two-level system, and , respectively. However, the results from the TAC-MCA system are and . The divergence between and is shown in Figs. 1(c) and 1(d) for the two different photon statistics. Simply, is almost equivalent to when is much smaller than the mean time between detection signals. But the differences cannot be neglected when the delay time is comparable to the time interval between the detection signals. To obtain a precise dynamical evolution using , we should correct the delay function .
In the experiment, we used an NV center in a diamond to demonstrate divergence in the results between the two measurement methods and the correction of from the TAC-MCA system to genuine . The single NV center is a bright and stable single-photon source[12,16–19], thst has been applied well in quantum information techniques and quantum imaging[9,20]. The NV center was artificially fabricated with nitrogen ion implantation. A home-built confocal microscope system was used to measure the NV center. The experimental setup is shown in Fig. 2. The green laser () with fixed power at 1.85 mW was applied to excite the NV center from the ground state to the excitation state. The fluorescent photons were collected and detected by two SPCMs. We can measure both with the TAC (ORTEC 567 TAC/SCA)-MCA (ORTEC EASY-MCA-8k) system and with an electronic delay (Stanford Research Systems DG645) after SPCM2. By controlling the reflection ratio of the BS and the optical coupling efficiency, the numbers of the fluorescent photons at each SPCM can be tunable. Figure 3 shows the measurement results with the two methods. When the measurement time scale is small () ( is the counting rate of the stop channel from SPCM2), the error of the delay function can be ignored. In Fig. 3(a), for , corresponding to the mean interval time of 20 μs between two neighboring detected photons, there was almost no difference between and if the delay was within 50 ns, since . However, when was extended to several microseconds, which was comparable to 20 μs, obvious differences between and are shown in Fig. 3(b). From the measurement, it is quite accurate to demonstrate the photon statistics of a single-photon source with antibunching behavior when the single-photon counting rate is much lower than the decay rate of the excitation state. However, it is necessary to make a correction when the delay time is comparable to the mean interval time between two neighboring detected photons.
Figure 2.Schematics of the experimental configuration with a home-built confocal microscope setup and HBT measurement. The diamond sample with a NV center on the piezo-stage (PZT) was excited by a continuous laser () through an objective with . The dichroic mirror (DM) was used to reflect the pump beam and transmit the fluorescent photons. The long pass (LP) filter further blocked the pump photons. The BS separated the photons into two SPCMs, followed by two measurement schemes.
Figure 3.Results from the prototype measurement with tunable electronic delay (large red dots, obtained by averaging the results of several repeated measurements) and the TAC-MCA system (small black dots). (a) The inset shows the measurement results with , which indicates negligible differences. (b) shows the measurement results with up to 20 μs and . Obvious differences can be observed.
For antibunched photons, such as the photon from the NV center, the second-order correlation function can be when is much larger than the decay rate of the excited state. Also, under this condition, the delay function . Formally, we can define with and can to be corrected with . Simply, should only depend on the counting rate of stop channel. Figure 4 shows the values of with different and same counting rate of start channel. The larger , the more difference between and . On the contrary, did not change with different counting rates of start channel if the counting rate of stop channel is keep unchanged. It is worthy to note that directly from the prototype measurement process with an electronic delay keeps almost a constant for different counting rates.
Figure 4.Measurement results from the prototype measurement with tunable electronic delay (large dots) and TAC-MCA system (small dots) with different counting rates of the stop channel (). The results from the prototype measurement shows little variation, while the data from TAC-MCA system have different results. The indices 1, 2, 3, 4, 5, 6 corresponded to .
As shown in Fig. 5(a), the can be fitted well with the decay curve of . As discussed, linearly depends on , which was demonstrated in Fig. 5(b). From the experimental data, should be replaced with by introducing the variables . By simply fitting the experimental data and correcting to , we found that . Figure 5(c) shows the corrected data from based on . It coincides well with the behavior of for different .
Figure 5.(a) shows the fitting result of with a single exponential decay function. ; (b) is the fitting of with a linear function according to the counting rates of the stop channel (); and (c) is the correction results for different . The indices are the same with Fig. 4.
In conclusion, we study the different measurement results of based on the prototype measurement process with tunable electronic delay and a TAC-MCA system. In the experiment, an NV center in a diamond is measured to demonstrate the divergence. Moreover, a correction function is presented to correct the results from the TAC-MCA system to the genuine . As the development of optical coupling techniques with nanophotonic structures such as the solid immersion lens[21–24], nanowire[25], and microcavity[26] progresses, the detected photon number will be greatly enhanced. As a result, the mean interval time between two neighboring detected photons will be much shortened. The measurement result from the TAC-MAC system will be invalid for demonstrating . For example, with the solid immersion lens, the detected photons from a single NV center can be [24] and the mean interval time between two neighboring detected photons is 1 μs. Such a mean interval time has the same order as the lifetime of the metastable state in NV center. Therefore, the detection of the photophysics in the NV center with is with errors and the correction is essential. Based on the correction, an accurate will provide an authentic way to study the dynamic evolution of single-photon source and other photon-matter interaction systems for quantum information.
References
[1] R. Hanbury Brown, R. Q. Twiss. Nature, 177, 27(1956).
[2] M. O. Scully, M. Suhail Zubairy. Quantum Optics(1997).
[3] M. Sun, X. He, M. Li, L. Wu. Chin. Opt. Lett., 14, 040301(2016).
[4] A. Zhang, W. Li, L. Zhao, H. Ye, Y. Liu, X. Wei, Z. Wang. Chin. Opt. Lett., 12, 052701(2014).
[5] H. J. Kimble, M. Dagenais, L. Mandel. Phys. Rev. Lett., 39, 691(1977).
[6] F. W. Sun, B. H. Liu, Y. X. Gong, Y. F. Huang, Z. Y. Ou, G. C. Guo. Phys. Rev. Lett., 99, 043601(2007).
[7] A. Beveratos, S. Kuhn, R. Brouri, T. Gacoin, J.-P. Poizat, P. Grangier. Eur. Phys. J. D, 18, 191(2002).
[8] T. Gaebel, I. Popa, A. Gruber, M. Domhan, F. Jelezko, J. Wrachtrup. New J. Phys., 6, 98(2004).
[9] J.-M. Cui, F.-W. Sun, X.-D. Chen, Z.-J. Gong, G.-C. Guo. Phys. Rev. Lett., 110, 153901(2013).
[10] D. G. Monticone, K. Katamadze, P. Traina, E. Moreva, J. Forneris, I. Ruo-Berchera, P. Olivero, I. Degiovanni, G. Brida, M. Genovese. Phys. Rev. Lett., 113, 143602(2014).
[11] J. Bernard, L. Fleury, H. Talon, M. Orrit. J. Chem. Phys., 98, 850(1993).
[12] C. Kurtsiefer, S. Mayer, P. Zarda, H. Weinfurter. Phys. Rev. Lett., 85, 290(2000).
[13] M. Berthel, O. Mollet, G. Dantelle, T. Gacoin, S. Huant, A. Drezet. Phys. Rev. B, 91, 035308(2015).
[14] G. Sallen, A. Tribu, T. Aichele, R. André, L. Besombes, C. Bougerol, M. Richard, S. Tatarenko, K. Kheng, J.-P. Poizat. Nat. Photonics, 4, 696(2010).
[15] J. Wolters, N. Sadzak, A. W. Schell, T. Schröder, O. Benson. Phys. Rev. Lett., 110, 027401(2013).
[16] M. Berthel, O. Mollet, G. Dantelle, T. Gacoin, S. Huant, A. Drezet. Phys. Rev. B, 91, 035308(2015).
[17] Y. Sonnefraud, A. Cuche, O. Faklaris, J.-P. Boudou, T. Sauvage, J.-F. Roch, F. Treussart, S. Huant. Opt. Lett., 33, 611(2008).
[18] R. Brouri, A. Beveratos, J.-P. Poizat, P. Grangier. Opt. Lett., 25, 1294(2000).
[19] A. Huck, S. Kumar, A. Shakoor, U. L. Andersen. Phys. Rev. Lett., 106, 096801(2011).
[20] X.-D. Chen, C.-L. Zou, Z.-J. Gong, C.-H. Dong, G.-C. Guo, F.-W. Sun. Light Sci. Appl., 4, e230(2015).
[21] S. M. Mansfield, G. S. Kino. Appl. Phys. Lett., 57, 2615(1990).
[22] P. Siyushev, F. Kaiser, V. Jacques, I. Gerhardt, S. Bischof, H. Fedder, J. Dodson, M. Markham, D. Twitchen, F. Jelezko, J. Wrachtrup. Appl. Phys. Lett., 97, 241902(2010).
[23] L. Marseglia, J. P. Hadden, A. C. Stanley-Clarke, J. P. Harrison, B. Patton, Y. D.-L. Ho, B. Naydenov, F. Jelezko, J. Meijer, P. R. Dolan, J. M. Smith, J. Q. Rarity, J. L. O’Brien. Appl. Phys. Lett., 98, 133107(2011).
[24] M. Jamali, I. Gerhardt, M. Rezai, K. Frenner, H. Fedder, J. Wrachtrup. Rev. Sci. Instrum, 85, 123703(2014).
[25] T. M. Babinec, B. J. M. Hausmann, M. Khan, Y. Zhang, J. R. Maze, P. R. Hemmer, M. Lončar. Nat. Nanotechnol., 5, 195(2010).
[26] A. Faraon, P. E. Barclay, C. Santori, K.-M. C. Fu, R. G. Beausoleil. Nat. Photonics, 5, 301(2011).