
Cunjun Ruan, Deyin Kong, Jun Dai, Kanglong Chen, Sujie Guo, Xiaojun Wu, "High-resolution frequency-domain spectroscopy for water vapor with coherent and continuous terahertz wave," Chin. Opt. Lett. 17, 073001 (2019)
- Chinese Optics Letters
- Vol. 17, Issue 7, 073001 (2019)
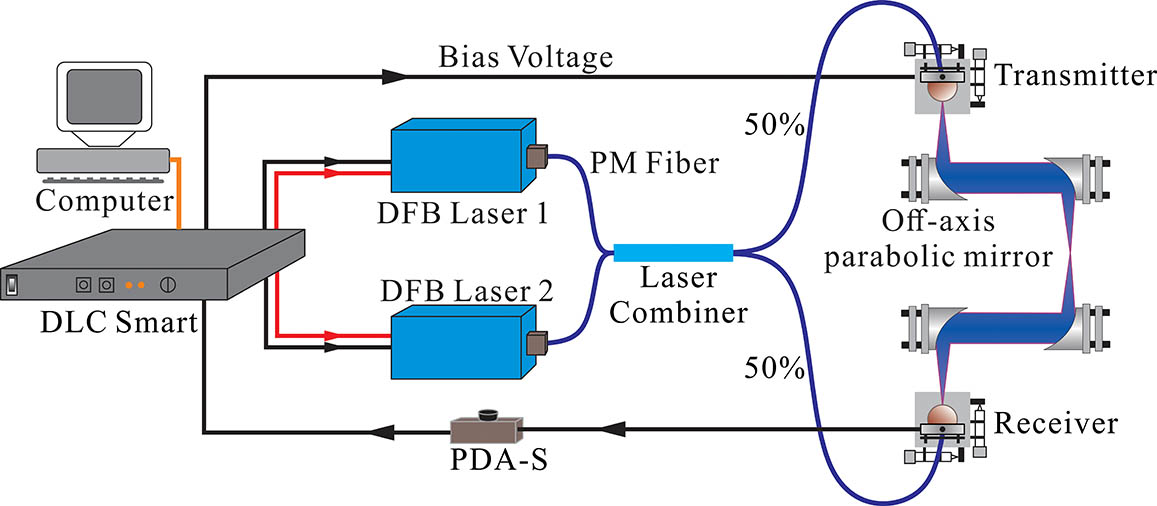
Fig. 1. Schematic of the THz-FDS.
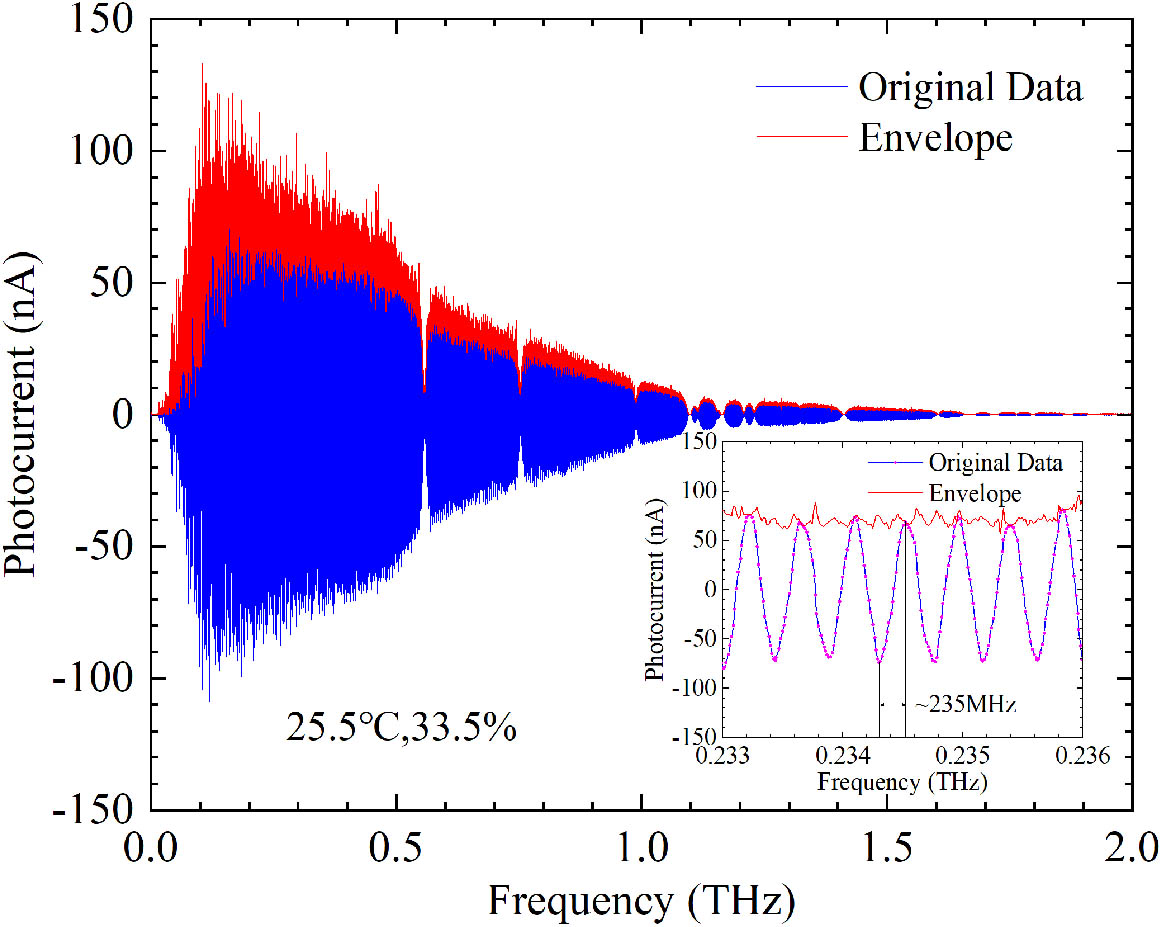
Fig. 2. Atmospheric water vapor transmittance signal measured by THz-FDS. The RH is 33.5%. The inset shows the obtained high resolution of 0.2 GHz.
Fig. 3. The gray curve is the envelope of the atmospheric water vapor transmittance signal, the blue one is the smoothed curve, and the red one is the fitted curve regardless of the absorption peaks. The RH is 7.5%, and the temperature is 24.8°C.
Fig. 4. The gray curves are the transmittance spectra of the atmospheric water vapor, the red curves are the smoothed results, and the green curves are the simulated results of SPECTRA. (a) The whole spectrum from 0.05 to 2 THz. (b), (c), and (d) Parts of the spectrum. The RH is 7.5%, and the temperature is 24.8°C (234.9 Pa).
Fig. 5. (a) Water vapor transmittance spectra measured by THz-FDS at RHs of 40.2%, 33.5%, 26%, 12%, and 7.5%, respectively. (b) The enlarged view of the transmittance spectra at 0.558 THz for different RHs. Green, measured results; red, simulated results; blue, smoothed result.
Fig. 6. Transmittance at 0.558, 0.753, and 0.989 THz for different RHs of 40.2%, 33.5%, 26%, 12%, and 7.5%, respectively.
Fig. 7. (a) Measured THz temporal waveform of the atmospheric water vapor (blue curve) and vacuum (red curve), and (b) the corresponding Fourier transform spectrum of the two kinds of environments, respectively.
Fig. 8. (a) Merged spectra of atmospheric water vapor measured by THz-TDS and THz-FDS. (b) Comparison of the zoom in graph for the absorption line at 0.558 THz.
|
Table 1. Partial Pressure


Set citation alerts for the article
Please enter your email address

© Copyright 2018-2021 | Chinese Laser Press. All Rights Reserved 沪ICP备15018463号-20