• Chinese Optics Letters
  • Vol. 17, Issue 8, 081701 (2019)
Nurfatihah Che Abd Rashid1, Nor Hafizah Ngajikin2、*, Asrul Izam Azmi1, Rashidah Arsat1, Suhaila Isaak1, Noran Azizan Cholan2, and Nur Ellina Azmi3
Author Affiliations
  • 1Faculty of Electrical Engineering, Universiti Teknologi Malaysia, 81310 Johor Bahru, Johor, Malaysia
  • 2Faculty of Electrical and Electronic Engineering, Universiti Tun Hussein Onn Malaysia, 86400 Bt. Pahat, Johor, Malaysia
  • 3Industrial Biotechnology Research Centre, SIRIM Berhad, 40200 Shah Alam, Selangor, Malaysia
  • show less
    DOI: 10.3788/COL201917.081701 Cite this Article Set citation alerts
    Nurfatihah Che Abd Rashid, Nor Hafizah Ngajikin, Asrul Izam Azmi, Rashidah Arsat, Suhaila Isaak, Noran Azizan Cholan, Nur Ellina Azmi. Spectrophotometer with enhanced sensitivity for uric acid detection[J]. Chinese Optics Letters, 2019, 17(8): 081701 Copy Citation Text show less
    Configuration of spectrophotometer.
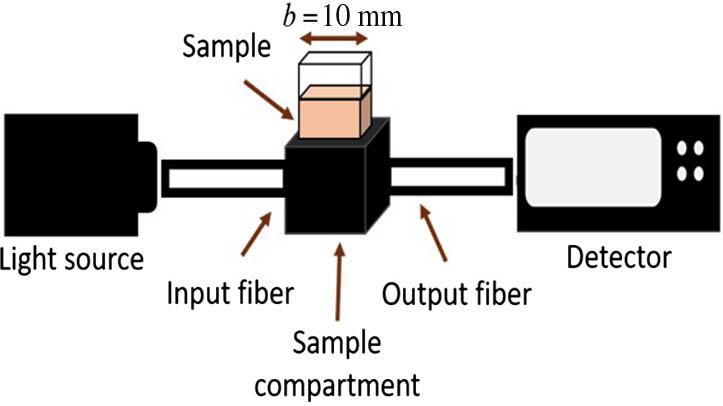
    Fig. 1. Configuration of spectrophotometer.
    Samples with different uric acid concentrations (a) before and (b) after stirring.
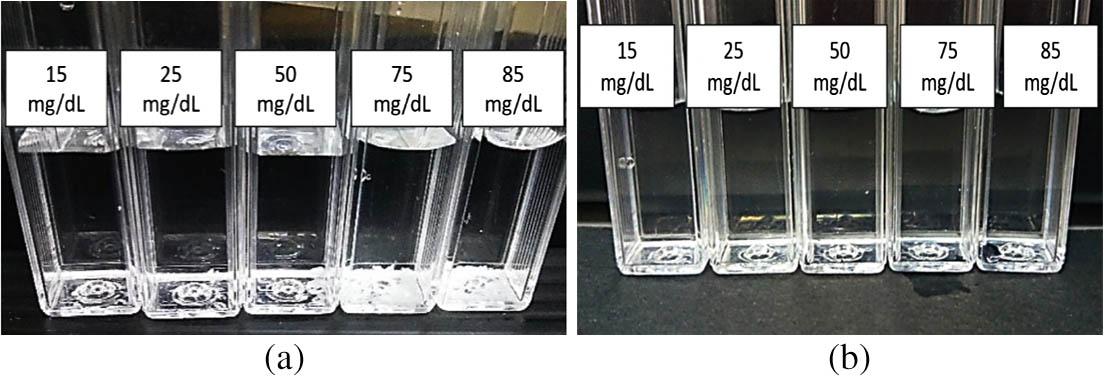
    Fig. 2. Samples with different uric acid concentrations (a) before and (b) after stirring.
    Light beam at 10 mm distance from the input fiber. (a) Halogen beam. (b) Gray-scale percentage for halogen light. (c) LED beam (460 nm wavelength). (d) Gray-scale percentage for LED light.
    Fig. 3. Light beam at 10 mm distance from the input fiber. (a) Halogen beam. (b) Gray-scale percentage for halogen light. (c) LED beam (460 nm wavelength). (d) Gray-scale percentage for LED light.
    Spectrometer output spectra. (a) Halogen. (b) LED (460 nm wavelength).
    Fig. 4. Spectrometer output spectra. (a) Halogen. (b) LED (460 nm wavelength).
    Light absorbance with variations of uric acid concentration at wavelengths of 460, 525, and 630 nm. (a) Halogen. (b) LED.
    Fig. 5. Light absorbance with variations of uric acid concentration at wavelengths of 460, 525, and 630 nm. (a) Halogen. (b) LED.
    Human urine sample in cuvette after mixing with NaOH solution.
    Fig. 6. Human urine sample in cuvette after mixing with NaOH solution.
    Absorbance analysis on human urine sample at 460 nm wavelength.
    Fig. 7. Absorbance analysis on human urine sample at 460 nm wavelength.
    ParameterHalogenLED
    Pbeam (μW)15.41.7
    Abeam (mm2)33.189.08
    φinteracted (nlm)7.33372.9582
    Le (mlm/W)0.47621.7401
    Table 1. Comparison of Light Characteristics Between Halogen and LED Light Sources at 460 nm Wavelength
    Light SourceWavelength (nm)Sensitivity (dL/mg)Accuracy (%)
    Halogen4600.001286.51
    5250.001191.17
    6300.000884.27
    LED4600.004696.62
    5250.003177.57
    6300.004579.43
    Table 2. Comparison of Spectrophotometer Performance
    Nurfatihah Che Abd Rashid, Nor Hafizah Ngajikin, Asrul Izam Azmi, Rashidah Arsat, Suhaila Isaak, Noran Azizan Cholan, Nur Ellina Azmi. Spectrophotometer with enhanced sensitivity for uric acid detection[J]. Chinese Optics Letters, 2019, 17(8): 081701
    Download Citation