Zongjie Zhang, Wei Li, Nan Ma, Xiaoyong Huang, "High-brightness red-emitting double-perovskite phosphor Sr2LaTaO6:Eu3+ with high color purity and thermal stability [Invited]," Chin. Opt. Lett. 19, 030003 (2021)
Copy Citation Text
Bright -activated double-perovskite red-emitting phosphors were successfully synthesized by a high-temperature solid-state method. Under near-ultraviolet excitation at 394 nm, optimal phosphors emitted high-brightness red light around 613 nm with the International Commission on Illumination chromaticity coordinates (0.650, 0.349). Notably, the color purity can reach 92%. Impressively, the favorable thermal stability of the phosphors was characterized by temperature-dependent emission spectra at different temperatures from 303 to 463 K, and the emission intensity at 423 K remained 73% of its value at 303 K. All of the results suggested that the as-prepared phosphors can be used in near-ultraviolet-excitable white light-emitting diodes as a red-emitting color converter.
Due to excellent energy efficiency, long service life, and environmental friendliness, white light-emitting diodes (LEDs) are considered to be the next-generation illumination solution[1–5]. Nowadays, the widely used white LEDs are commonly manufactured by combining InGaN blue LED chips with yellow-emitting phosphors[6]. However, due to the lack of red light, there are some limitations in these white LEDs, including highly correlated color temperature (CCT) and low color rendering index (CRI)[7]. At present, the near-ultraviolet (UV) LED chips coated with tri-color (blue, green, and red) phosphors are proposed as a promising way to fabricate white LEDs[8–10]. Thus, research on near-UV-light-excitable red phosphor is a very meaningful work.
The ion is a superior rare-earth ion to achieve red light emission[11–14]. As a host material, a double-perovskite compound with molecular formula is a wise choice for the luminescence field[15]. Phosphors based on double-perovskite compounds could show excellent chemical and physical stability and outstanding optical characteristics.
To the best of our knowledge, no publication has reported on ion-doped (abbreviated as SLT) double-perovskite so far. Herein, we reported on the synthesis and luminescent properties of -activated SLT red-emitting phosphors. Single-phase phosphors were prepared by the conventional high-temperature solid-state reaction method. These phosphors showed an excitation peak around 394 nm, which matched well with the emission wavelength of near-UV LED chips. Upon excitation at 394 nm, bright red emissions around 613 nm were observed, along with high color purity of 92%. The resistance to luminescence thermal quenching at high temperatures was also studied.
Sign up for Chinese Optics Letters TOC. Get the latest issue of Chinese Optics Letters delivered right to you!Sign up now
2. Experimental Section
2.1. Synthesis of the samples
The SLT host and (, 0.15, 0.2, 0.25, and 0.3) phosphors were synthesized by the high-temperature solid-state reaction route. (99%, Aladdin Industrial Corporation, Shanghai, China), (99.99%, Jining Tianyi New Materials Co., Ltd.), (99.5%, Aladdin Industrial Corporation, Shanghai, China), and (99.99%, Jining Tianyi New Materials Co., Ltd.) were used as the starting materials, and stoichiometric amounts of these chemicals were weighed. Afterward, the mixtures were thoroughly ground by an agate mortar. The resulting mixtures were put into the alumina crucibles and then heated at 600°C for 3 h and 1500°C for 6 h.
2.2. Characterization
The phase formation of the phosphors and SLT host was investigated by powder X-ray diffraction (PXRD) with Cu Kα (ÅÅ) radiation. Then, the photoluminescence excitation (PLE) and photoluminescence (PL) spectra and decay curves were measured by an Edinburgh FS5 spectrometer with the 150 W xenon lamp and the pulsed xenon lamp as the light source, respectively. Eventually, the temperature-dependent PL spectra of phosphors were recorded by the same spectrometer connected with a temperature controller (TAP-02).
3. Results and Discussion
3.1. Phase purity
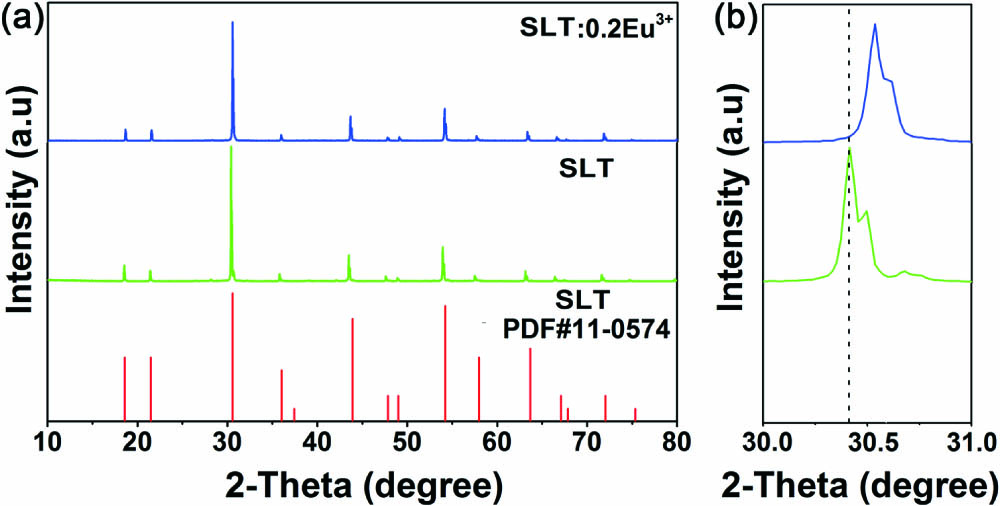
To confirm the phase purity of the as-prepared phosphors, Fig. 1(a) shows the PXRD patterns of the SLT host and phosphors. All of the PXRD peaks of these two samples match well with the standard power diffraction file (PDF) card (PDF #11-0574) of the SLT compound, which indicated that the crystal structure of the as-prepared phosphors did not change after doping. As shown in Fig. 1(b), compared with the pure SLT host, the diffraction peak of the sample shifted to a larger angle. This phenomenon can be as attributed to the fact that in phosphors the smaller ion [Å, coordination number (CN) = 6] replaced the larger ion (Å, )[16,17].
Figure 1.PXRD patterns of the SLT:0.2Eu3+ phosphors and SLT host, in the range of (a) 10–80 deg and (b) 30–31 deg.
The PLE and PL spectra of phosphors are given in Fig. 2(a). It is clear to see that the strongest peaks of the excitation and emission bands were located at 394 and 613 nm, respectively. When monitored at the 613 nm emission, the obtained PLE spectrum of phosphors mainly contained a broad excitation band in the 250–315 nm wavelength range and a group of sharp excitation peaks in the 325–500 nm spectral range. The former broad band originated from the charge transfer band (CTB). The latter sharp PLE peaks were ascribed to the ‐ transitions of ions, namely, 325 nm ( transition), 364 nm ( transition), 385 nm ( transition), 394 nm ( transition), 415 nm ( transition), and 466 nm ( transition)[18–20]. Under 394 nm excitation, the phosphors exhibited bright red light. The PL spectrum consisted of several typical sharp emission peaks at 595, 613, 656, and 710 nm, which were attributed to the , , , and transitions, respectively[21].
Figure 2.(a) PLE and PL spectra of the SLT:0.2Eu3+ phosphors. (b) PL spectra of the SLT:xEu3+ (x = 0.1, 0.15, 0.2, 0.25, and 0.3) phosphors. (c) The line chart for PL integrated intensity and Eu3+ doping concentration. (d) Decay curves for SLT:xEu3+ phosphors.
Figure 2(b) shows the PL spectra of (, 0.15, 0.2, 0.25, and 0.3) phosphors under 394 nm excitation. It can be seen that all of these emission spectra exhibited similar profiles, and the strongest PL intensity was achieved at . Figure 2(c) displays the change trend of the integral emission intensity of phosphors with different doping concentrations. As can be seen, the optimal doping concentration of ions was 20% (mole fraction). When was higher than 0.2, the emission intensity gradually reduced with increasing concentration, due to the concentration quenching effect. The observed concentration quenching was attributed to the energy transfer among nearby ions[22].
Luminescence decay curves (, ) for phosphors are shown in Fig. 2(d). The lifetimes can be fitted using a single exponential function[23]: where and refer to the luminescence intensities of phosphors at time and zero, and represents the decay lifetime. The values of decay lifetime for samples are listed in Fig. 2(d). The values of decay lifetimes were around 1 ms, which were similar to the reported -activated phosphors, such as ()[22] and ()[11].
The PL spectra of the as-prepared phosphors and commercial red phosphors are shown in Fig. 3(a). Upon 394 nm excitation, the integrated emission intensity of phosphors was about three times higher than that of commercial red phosphors. To better understand the luminescence mechanism of as-prepared phosphors, the corresponding energy level diagram is illustrated in Fig. 3(b).
Figure 3.(a) PL spectra of the as-prepared SLT:0.2Eu3+ phosphors and commercial Y2O2S:Eu3+ red phosphors. (b) Schematic illustration of Eu3+ ions energy level in SLT:Eu3+ phosphors. (c) The asymmetry ratio as a function of Eu3+ doping concentration in SLT:Eu3+ phosphors upon 394 nm excitation. (d) CIE chromaticity diagram for SLT:0.2Eu3+ phosphors (λex = 394 nm). The inset shows the digital photograph of SLT:0.2Eu3+ phosphors under a 365 nm lamp.
The asymmetry ratio (R/O), which is determined as the intensity ratio of red emission ( transition) to orange emission ( transition), can be used to characterize the centrosymmetric geometry of the activator. As shown as Fig. 3(c), all of the R/O values of samples were calculated in the range from 2.6 to 2.8. The calculated result illustrated that the dopants occupied the asymmetric sites, which was good for high color purity. Figure 3(d) shows the International Commission on Illumination (CIE) chromaticity diagram () and the photograph (under a 365 nm lamp) of phosphors. Clearly, the phosphors emitted bright red light under the 365 nm UV lamp. The CIE chromaticity coordinates of phosphors were determined to be (0.650, 0.349), which were much closer to that of ideal red light (0.67, 0.33). The color purity is an important property for phosphor. The value of color purity can be obtained by the following equation[24]: where (, ), (, ), and (, ) are the CIE coordinates of samples, corresponding to the dominating wavelength and white light, respectively. For the sample, the values of (, ), (, ), and (, ) were (0.650, 0.349), (0.682, 0.318), and (0.310, 0.316). The value of the color purity was calculated to be 92%, which was higher than that of (color purity: 87%)[25] and (color purity: 90%)[26].
3.3. Thermal stability
Figure 4(a) shows the temperature-dependent PL spectra of phosphors. With the temperature increasing from 303 K to 463 K, the PL intensity gradually decreased. The temperature-dependent normalized integrated PL intensity is depicted in Fig. 4(b). When the temperature of the sample was 423 K, the emission intensity of the sample still reserved 73% of the intensity at 303 K. For further comprehending the thermal quenching behavior, the activation energy () can be calculated by Arrhenius equation[27]: where is the initial emission intensity, is the intensity at temperature , is a constant, and is the Boltzmann constant. As shown in Fig. 4(c), the slope of versus () was , which meant that the value of the was 0.26 eV. The thermal quenching process of ions in phosphors is illustrated in Fig. 4(d).
Figure 4.(a) PL spectra of the SLT:0.2Eu3+ phosphors at different temperature from 303 to 463 K. (b) Normalized integrated temperature-dependent PL intensity in wavelength range of 550–750 nm. (c) Fitting plot of ln (I0/I-1) versus 1/kT for SLT:Eu3+ phosphors. (d) Configuration diagram of the ground and excited states for Eu3+ ions in SLT:Eu3+ phosphors.
In this work, highly luminescent red phosphors have been prepared by using a facile high-temperature solid-state approach. The PXRD certified that phosphors with pure phase were prepared. The optimal doping concentration of ions was . Upon 394 nm excitation, the intensity of phosphors was about three times as great as commercial red phosphors. Notably, the CIE chromaticity coordinates of phosphors were (0.650, 0.349), and the color purity can reach as high as 92%. Besides, was obtained as 0.26 eV, and the emission intensity of phosphors at 423 K was 73% of that at 303 K. These results suggested that the as-prepared red phosphors can be used as color converter in near-UV-pumped white LEDs.
Zongjie Zhang, Wei Li, Nan Ma, Xiaoyong Huang, "High-brightness red-emitting double-perovskite phosphor Sr2LaTaO6:Eu3+ with high color purity and thermal stability [Invited]," Chin. Opt. Lett. 19, 030003 (2021)