
Wen Ai, Xiao-Hui Hu, Lin Pan, Chang-Chun Chen, Yi-Feng Wang, Xiao-Dong Shen. Sensing performance of two-dimensional WTe2-based gas sensors [J]. Acta Physica Sinica, 2019, 68(19): 197101-1
- Acta Physica Sinica
- Vol. 68, Issue 19, 197101-1 (2019)
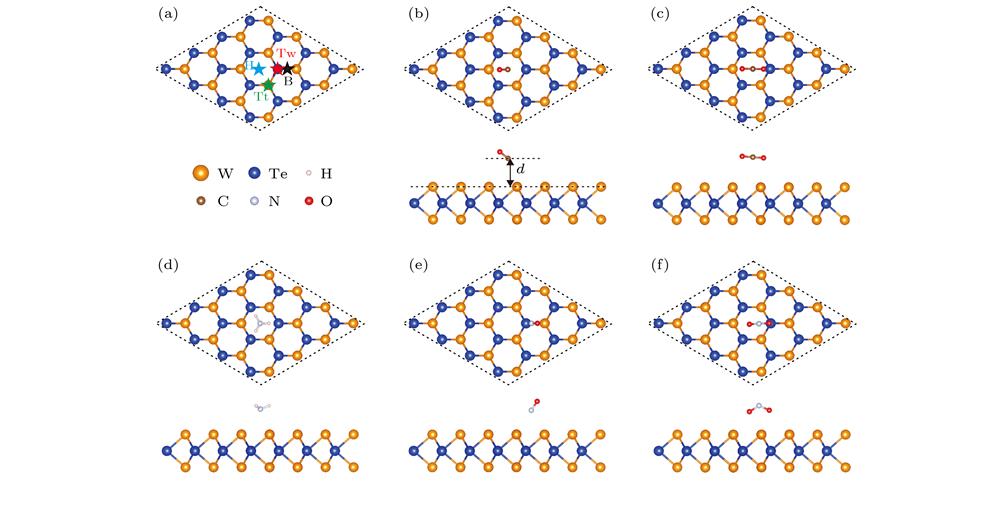
Fig. 1. (a) Schematic diagram of four different adsorption sites; the top view and side view of the most favorable configurations of monolayer WTe2 with (b) CO, (c) CO2, (d) NH3, (e) NO, and (f) NO2 adsorption; the definition of adsorption distance d is shown in (b).
(a) 四个不同的吸附位点示意图; (b) CO, (c) CO2, (d) NH3, (e) NO和(f) NO2吸附在单层WTe2表面最稳定构型的俯视图和侧视图; 吸附距离d 的定义如 (b) 所示
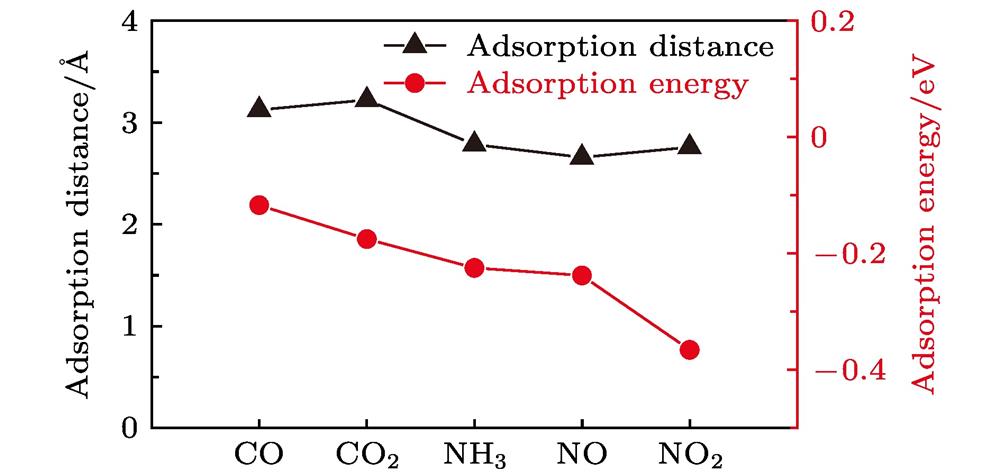
Fig. 2. Adsorption distance and adsorption energy for CO, CO2, NH3, NO, and NO2 on WTe2 monolayer.
CO, CO2, NH3, NO, NO2气体分子与单层WTe2之间的吸附距离和吸附能
Fig. 3. The charge difference between WTe2 monolayer and gas molecules for (a) CO, (b) CO2, (c) NH3, (d) NO and (e) NO2. The isosurface is taken as 6.0 × 10⁻⁴e /Å3. The electron accumulation (depletion) is indicated by yellow (blue) color. The direction (indicated by an arrow) and value of the charge transfer are shown.
(a) CO, (b) CO2, (c) NH3, (d) NO和 (e) NO2气体分子与单层WTe2之间的差分电荷密度. 等值面取6.0 × 10⁻⁴e /Å3, 电子积累(损耗)分别用黄色(蓝色)表示, 同时标注了电荷转移的方向(用箭头表示)和电荷转移量
Fig. 4. (a) The band structure of pristine WTe2; band structure of (b) CO, (c) CO2 and (d) NH3 adsorbed on WTe2 monolayer; band structure of (e), (f) NO and (g), (h) NO2 adsorbed on WTe2 monolayer, the blue and red lines represent the band structure of spin-up and spin-down, respectively. The olive dots represent the projected band structure of the adsorbed gas molecules.
(a) 本征WTe2的能带结构图; (b) CO, (c) CO2和 (d) NH3吸附在单层WTe2表面的能带结构图; (e), (f) NO和 (g), (h) NO2吸附在单层WTe2表面的能带结构图. 其中蓝线和红线分别表示自旋向上和自旋向下的能带结构, 橄榄色的点线表示吸附气体分子的投影能带结构
Fig. 5. The density state of (a) CO, (b) CO2, (c) NH3, (d) NO and (e) NO2 adsorbed on WTe2 monolayer, respectively. The spin density distribution of (f) NO and (g) NO2 adsorbed on WTe2 monolayer
(a) CO, (b) CO2, (c) NH3, (d) NO和 (e) NO2分别吸附在单层WTe2上的分态密度图; (f) NO和 (g) NO2吸附在WTe2表面的自旋密度分布图

Set citation alerts for the article
Please enter your email address
© Copyright 2018-2021 | Chinese Laser Press. All Rights Reserved 沪ICP备15018463号-20