Author Affiliations
1School of Economics, Yunnan University of Finance and Economics, Kunming 650221, China2Institute of Land & Resources and Sustainable Development, Yunnan University of Finance and Economics, Kunming 650221, China3Institute of Targeted Poverty Alleviation and Development, Yunnan University of Finance and Economics, Kunming 650221, Chinashow less
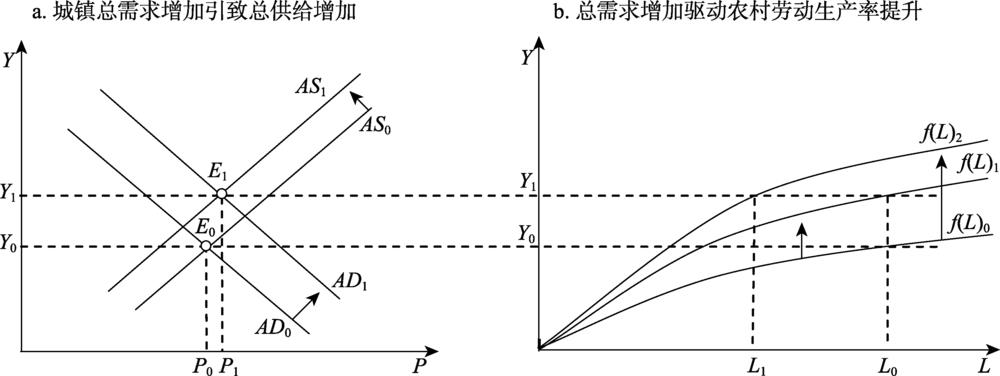
Fig. 1. Mechanism of rural labor productivity improvement driven by urbanization
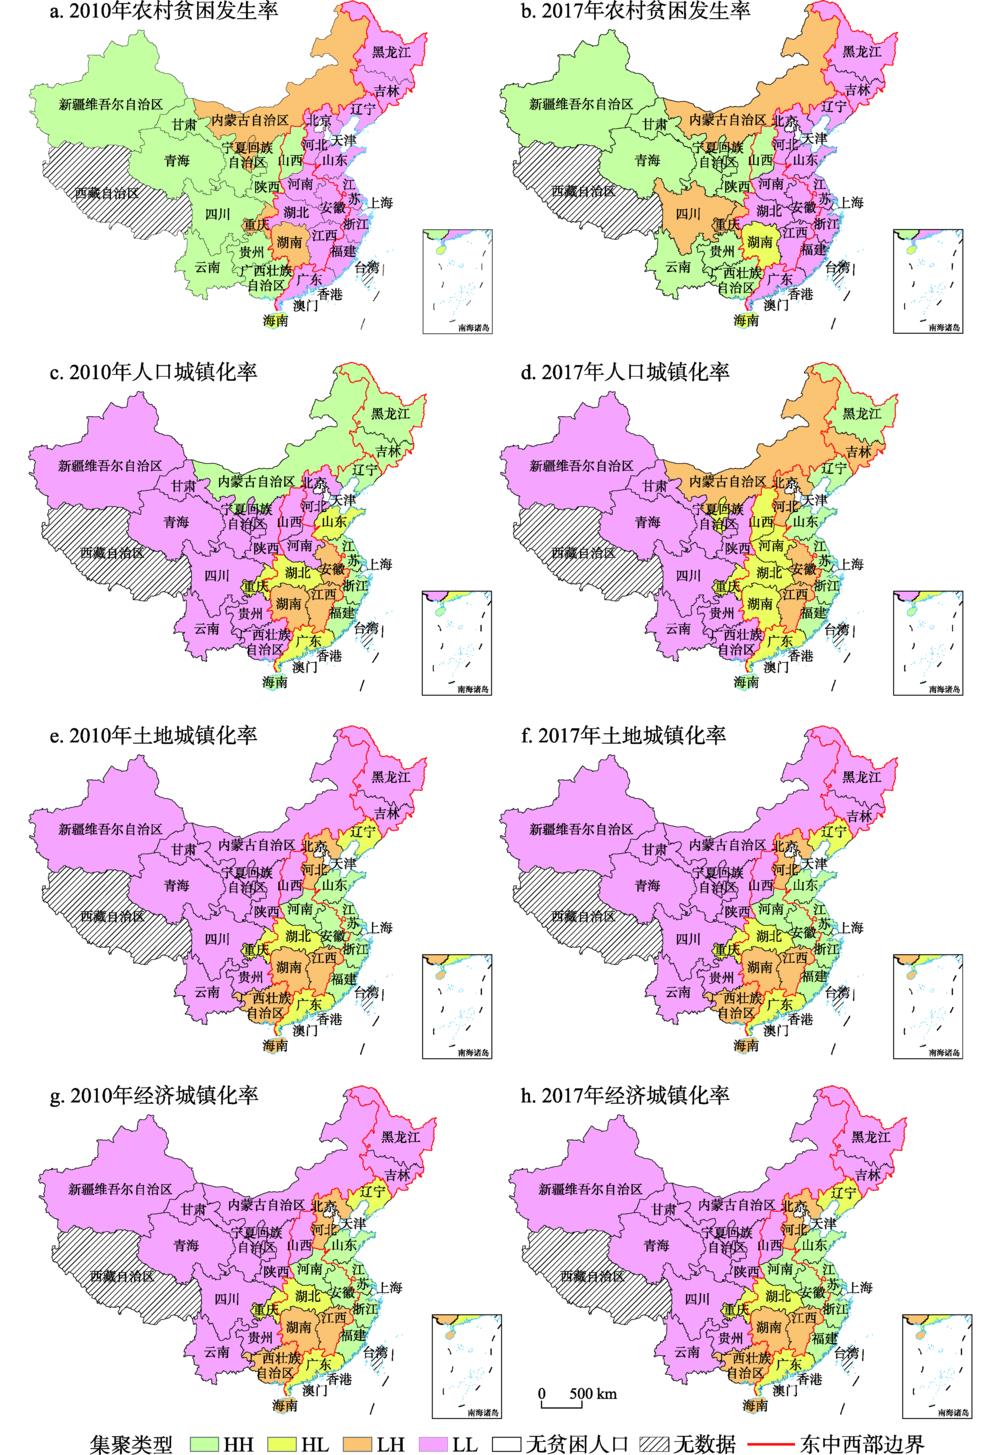
Fig. 2. Spatial clustering of rural poverty and urbanization in provinces of China from 2010 to 2017
Fig. 3. Effects of rural poverty alleviation by population, land and economic urbanization respectively
Fig. 4. Comparison of population urbanization and threshold value in provinces of China from 2010 to 2017
Fig. 5. Comparison of economic urbanization and threshold value in provinces of China from 2010 to 2017
| 变量类型 | 具体指标(变量) | 指标含义(单位) |
|---|
| 被解释变量 | 农村贫困发生率(pove) | 农村贫困人口占农村总人口比例(%) | | 核心解释变量 | 人口城镇化(urb_p) | 城镇常驻人口占总人口比例(%) | | 土地城镇化(urb_l) | 建成区面积占总面积比例(%) | | 经济城镇化(urb_e) | 第三产业产值占GDP的比例(%) | | 控制变量 | 经济增长(gdp_g) | GDP增长率(%) | | 农村收入水平(inco) | 农民人均纯收入(元) | | 城乡收入差距(u_r_d) | 城乡居民人均收入之比 | | 农村转移人口就业环境(empl) | 城镇登记失业率(%) | | 农村人力资本(huma) | 农村人口平均受教育年限(年) | | 农村市场化水平(mark) | 农村人均社会消费品零售额(万元) | | 农村资本投入(capi) | 农村住户人均固定资产投资(万元) | | 农村技术进步(tech) | 农林牧渔业单位产值农用机械总动力(kW/万元) | | 农村劳动生产率(prod) | 农村单位劳动力农林牧渔业产出(万元) | | 农村扶贫政策(poli) | 农村低保人口与总人口之比(%) |
|
Table 1. Variable description and explanation
| 变量 | 样本数 | 均值 | 方差 | 最小值 | 最大值 |
|---|
| pove | 216 | 10.1255 | 8.6124 | 0.0000 | 45.1000 | | urb_p | 216 | 52.6840 | 8.3339 | 33.8100 | 69.8500 | | urb_l | 216 | 1.0372 | 0.9466 | 0.0200 | 4.3100 | | urb_e | 216 | 41.8125 | 5.8811 | 28.6000 | 56.1000 | | gdp_g | 216 | 9.8121 | 2.8180 | -2.5000 | 17.1000 | | u_r_d | 216 | 2.7782 | 0.4432 | 2.0600 | 4.0700 | | empl | 216 | 3.3942 | 0.5460 | 1.7300 | 4.4700 | | huma | 216 | 8.3059 | 0.3220 | 7.4300 | 9.0700 | | mart | 216 | 0.4719 | 0.3213 | 0.1100 | 2.0400 | | capi | 216 | 0.1580 | 0.0542 | 0.0600 | 0.3700 | | tech | 216 | 1.2882 | 0.5384 | 0.3900 | 2.7000 | | prod | 216 | 81.3034 | 37.1621 | 17.6600 | 178.7300 | | poli | 216 | 7.8815 | 4.9441 | 1.0900 | 23.5300 |
|
Table 2. Descriptive statistics
| 年份 | pove | | urb_p | | urb_l | | urb_e |
|---|
| Moran′s I | P值 | Moran′s I | P值 | Moran′s I | P值 | Moran′s I | P值 |
|---|
| 2010 | 0.476 | <0.001 | | 0.330 | 0.002 | | 0.379 | <0.001 | | 0.202 | 0.027 | | 2011 | 0.511 | <0.001 | 0.307 | 0.003 | 0.381 | <0.001 | 0.171 | 0.048 | | 2012 | 0.501 | <0.001 | 0.291 | 0.005 | 0.392 | <0.001 | 0.142 | 0.078 | | 2013 | 0.490 | <0.001 | 0.293 | 0.005 | 0.400 | <0.001 | 0.139 | 0.082 | | 2014 | 0.496 | <0.001 | 0.286 | 0.005 | 0.498 | <0.001 | 0.016 | 0.334 | | 2015 | 0.492 | <0.001 | 0.293 | 0.005 | 0.409 | <0.001 | -0.155 | 0.182 | | 2016 | 0.457 | <0.001 | 0.301 | 0.004 | 0.396 | <0.001 | -0.184 | 0.128 | | 2017 | 0.453 | <0.001 | 0.302 | 0.004 | 0.406 | <0.001 | -0.045 | 0.481 |
|
Table 3. Global Moran's I of rural poverty and urbanization in provinces of China from 2010 to 2017
| 普通OLS模型检验统计量 | 数值 | P值 | 空间面板模型检验统计量 | 数值 | P值 |
|---|
| F值 | 68.26 | <0.001 | Hausman | 72.73 | <0.001 | | Adj R2 | 0.82 | | Robust Hausman | 210.99 | <0.001 | | LM_Spatial error | 26.86 | <0.001 | Wald_Spatial error | 61.66 | <0.001 | | Robust LM_Spatial error | 0.24 | 0.623 | LR_Spatial error | 69.13 | <0.001 | | LM_Spatial lag | 62.57 | <0.001 | Wald_Spatial lag | 55.91 | <0.001 | | Robust LM_Spatial lag | 35.96 | <0.001 | LR_Spatial lag | 51.11 | <0.001 |
|
Table 4. Results of model test
| 变量 | SPDM | | SPLM | | SPEM | | 非空间固定效应 | | SPDM空间滞后项(WX) |
|---|
| 空间固定 | 时间固定 | 双固定 | 空间固定 | 空间固定 | 空间固定 | 时间固定 | 双固定 |
|---|
| 模型(1) | 模型(2) | 模型(3) | 模型(4) | 模型(5) | 模型(6) | 模型(1) | 模型(2) | 模型(3) | | urb_p | -3.851*** | -3.279*** | -4.035*** | | -3.758*** | | -4.232*** | | -4.524*** | | -1.733 | -5.248*** | -2.637** | | (-8.63) | (-7.02) | (-9.02) | (-9.56) | (-10.05) | (-5.29) | (-1.52) | (-4.60) | (-2.27) | | (urb_p)2 | 0.039*** | 0.029*** | 0.039*** | | 0.031*** | | 0.036*** | | 0.034*** | | 0.012 | 0.057*** | 0.023* | | (8.37) | (6.25) | (8.55) | (7.48) | (8.21) | (3.64) | (1.01) | (5.07) | (1.81) | | urb_l | 1.848 | -7.626*** | 3.845 | | 5.068 | | 2.326 | | 11.285 | | 9.828 | -7.051** | 18.255* | | (0.42) | (-5.69) | (0.87) | (1.26) | (0.53) | (1.45) | (1.04) | (-2.34) | (1.84) | | (urb_l)2 | 0.149 | 1.670*** | -0.302 | | -0.475 | | -0.835 | | -1.314 | | -1.984 | 1.108 | -1.629 | | (0.26) | (5.71) | (-0.50) | (-0.89) | (-1.44) | (-1.45) | (-1.25) | (1.42) | (-1.00) | | urb_e | 1.100*** | 1.319*** | 0.773* | | 0.397 | | -0.218 | | 0.017 | | 1.624** | -0.420 | 1.247 | | (2.93) | (3.07) | (1.85) | (1.21) | (-0.60) | (0.02) | (2.18) | (-0.44) | (1.26) | | (urb_e)2 | -0.013*** | -0.017*** | -0.010** | | -0.006* | | 0.001 | | -0.003 | | -0.022** | -0.011 | -0.019* | | (-3.16) | (-3.37) | (-1.98) | (-1.68) | (0.31) | (-0.31) | (-2.55) | (-0.95) | (-1.68) | | gdp_g | -0.013 | 0.076 | -0.119 | | 0.063 | | 0.006 | | 0.226 | | 0.222 | -0.925*** | -0.436* | | (-0.12) | (0.57) | (-1.14) | (0.64) | (0.05) | (1.23) | (1.08) | (-3.11) | (-1.67) | | u_r_d | 0.378 | 1.081 | -0.049 | | -1.122 | | 2.612* | | -0.236 | | -3.250 | -6.638*** | -1.689 | | (0.25) | (1.01) | (-0.03) | (-0.90) | (1.81) | (-0.08) | (-1.36) | (-2.99) | (-0.48) | | empl | 1.898*** | -2.014*** | 1.787*** | | 2.093*** | | 2.422*** | | 3.340*** | | 3.418** | 1.915* | 1.815 | | (3.18) | (-5.02) | (3.05) | (3.50) | (3.70) | (3.44) | (2.07) | (1.66) | (1.05) | | huma | -1.572 | 3.118*** | -1.372 | | -3.739*** | | -3.697*** | | -5.409** | | 1.814 | -0.266 | 4.269 | | (-1.24) | (2.85) | (-1.09) | (-2.79) | (-2.75) | (-2.62) | (0.69) | (-0.10) | (1.47) | | mart | 3.038 | -5.176*** | 3.179 | | 2.186 | | 3.259** | | 4.071* | | -5.708 | -0.170 | -5.400 | | (1.52) | (-3.89) | (1.63) | (1.46) | (2.02) | (1.75) | (-1.50) | (-0.05) | (-1.31) | | capi | -25.592*** | -5.970 | -27.078*** | | -21.471*** | | -26.196*** | | -27.301 | | -13.473 | -60.926*** | 2.430 | | (-4.02) | (-1.13) | (-4.20) | (-4.20) | (-4.94) | (-1.25) | (-1.01) | (-4.66) | (0.16) | | tech | 0.690 | 0.392 | 0.578 | | 0.335 | | 0.884 | | 0.203 | | -0.843 | 1.815 | -0.691 | | (1.04) | (0.54) | (0.87) | (0.52) | (1.37) | (0.18) | (-0.62) | (1.25) | (-0.44) | | prod | -0.039** | -0.037*** | -0.041** | | -0.022 | | -0.039** | | -0.038 | | 0.016 | -0.100*** | 0.021 | | (-2.05) | (-2.99) | (-2.14) | (-1.38) | (-2.03) | (-1.68) | (0.49) | (-3.27) | (0.59) | | poli | 0.249*** | 0.096 | 0.231*** | | 0.092** | | 0.196*** | | 0.115** | | -0.178** | 0.214 | -0.108 | | (3.70) | (1.13) | (3.50) | (2.17) | (2.63) | (2.17) | (-2.30) | (1.49) | (-1.00) | | ρ/λ | 0.361*** | 0.205** | 0.080 | | 0.465*** | | 0.780*** | | | | | | | | R2 | 0.936 | 0.829 | 0.321 | | 0.914 | | 0.836 | | 0.889 | | | | | | Log L | -386.542 | -475.152 | -373.455 | | -415.473 | | -429.328 | | -449.930 | | | | |
|
Table 5. Estimation of spatial and non-spatial panel fixed effects model
| 变量 | 直接效应 | | 间接效应 | | 总效应 |
|---|
| 系数 | P值 | 系数 | P值 | 系数 | P值 |
|---|
| urb_p | -4.148*** | <0.001 | | -4.669*** | 0.004 | | -8.817*** | <0.001 | | (urb_p)2 | 0.041*** | <0.001 | 0.040** | 0.036 | 0.081*** | <0.001 | | urb_l | 3.245 | 0.470 | 14.000 | 0.321 | 17.246 | 0.289 | | (urb_l)2 | -0.083 | 0.886 | -2.697 | 0.249 | -2.780 | 0.286 | | urb_e | 1.294*** | 0.001 | 2.984*** | 0.009 | 4.278*** | 0.002 | | (urb_e)2 | -0.016*** | <0.001 | -0.039*** | 0.003 | -0.055*** | 0.001 | | gdp_g | 0.012 | 0.913 | 0.324 | 0.257 | 0.335 | 0.282 | | u_r_d | 0.045 | 0.974 | -4.602 | 0.186 | -4.557 | 0.194 | | empl | 2.354*** | <0.001 | 6.244** | 0.019 | 8.598*** | 0.005 | | huma | -1.434 | 0.304 | 1.776 | 0.696 | 0.341 | 0.949 | | mart | 2.545 | 0.260 | -6.603 | 0.307 | -4.059 | 0.616 | | capi | -27.285*** | <0.001 | -32.802* | 0.095 | -60.087*** | 0.010 | | tech | 0.633 | 0.353 | -0.767 | 0.705 | -0.134 | 0.954 | | prod | -0.040** | 0.037 | 0.006 | 0.902 | -0.034 | 0.147 | | poli | 0.244*** | <0.001 | -0.127 | 0.159 | 0.117 | 0.538 |
|
Table 6. Decomposed spatial effects of SPDM with spatial fixed effects