Guangdong Provincial Key Laboratory of Optical Fiber Sensing and Communications, Institute of Photonics Technology, Jinan University, Guangzhou 510632, China
All-optical ultrasound probes that contain a photoacoustically-based ultrasound generator paired with a photonic acoustic sensor provide a promising imaging modality for diagnostic and MRI-compatible applications. Here, we demonstrate the fabrication of a fiber-based all-optical ultrasound probe and its applications in pulse-echo ultrasound imaging. The ultrasound generator is fabricated on a 125 μm multimode optical fiber by forming a light-absorbing multiwalled carbon nanotube (MWCNT)-polydimethylsiloxane (PDMS) composite coating on its distal end. A peak-to-peak acoustic pressure of 0.95 MPa was achieved with laser irradiation at 2.46 μJ by chemically functionalizing the fiber surface to enable a strong adsorption. Ultrasound reception was performed by a fiber-laser ultrasound sensor that translates ultrasound pressure into differential lasing-frequency changes. By linearly scanning the probe, ex vivo two- and three-dimensional imaging of a segment of swine trachea was demonstrated by detecting the echo ultrasound signals and reconstructing the acoustic scatterers. The probe presents axial and lateral resolutions at 150 and 62 μm, respectively. The small-sized, side-looking all-fiber ultrasound probe presents a promising approach for assembling an interventional endoscopy.
Pulse-echo ultrasound imaging has been widely used in biomedical applications, particularly for clinical diagnostics[1,2]. In current imaging instrumentation, an ultrasound transducer array generates ultrasonic pulses and subsequently detects pulse-echo signals that contain information on the elastic contrasts of the samples and their positions. However, the detection bandwidths and vision angles of the piezoelectric transducers are somewhat limited (typically 1 to 5 MHz in bandwidth and 40° in vision angle). As a result, the spatial resolution is rather limited and vertical structures can be hardly visible. Recently, the development of all-optical ultrasound devices has attracted increasing interest. Optical ultrasound generators based on the photoacoustic effect can provide comparable or even higher ultrasound pressure and much wider bandwidths that are required to achieve a high sensitivity and spatial resolution in pulse-echo imaging. Light-absorbing materials and membranes are formed on a transparent substrate, where the absorption of pulsed or amplitude-modulated light results in localized heating and its translation into ultrasonic waves[3,4]. A number of absorbers including carbon-based nanofibers, nanotubes, and graphene oxide have been employed, and covered with highly thermally expandable polymers for efficient translation of heat into sound waves[5–7]. One distinct advantage of optical ultrasound excitation is that the acoustic source geometry can be flexibly controlled. For example, geometric focusing with a high numerical aperture can be easily achieved by constructing a concave absorbing surface[8,9]. Mechanically scanning the pulse laser beam over the individual cores of a fiber bundle or over a geometrically extended absorption membrane can synthesize a desired source array[10,11]. On the other hand, optical ultrasound detection has been demonstrated based on free-space optical interferometry or acoustically induced deflection/polarization variation of the light beam[12–15]. Mini- or micro-scaled sensors have also been developed with high-finesse Fabry–Perot or ring shaped, acoustically deformable cavities[16,17]. Recently, high-sensitivity ultrasonic detection with optical fibers has been reported by using phase-shifted fiber gratings, on-tip optical microcavities, and lasers[18–20]. Pulse-echo biomedical imaging has been demonstrated by pairing the optical ultrasound generator and detector[10,11,16,17,19].
Now the question is how to develop an all-optical ultrasound probe based on optical fiber technology toward miniatured imaging instrumentation and micro-endoscopy. The challenges include how to build a sufficiently strong acoustic source with a limited laser-irradiated area as well as a highly sensitive fiber optic sensor. Attempts have been made by using a fiber bundle as a synthesized acoustic source array paired with a fiber optic sensor[11]. However, the fiber bundle is typically several millimeters in diameter, much thicker than the sensor. In this work, we present an all-optical ultrasound probe by using optical fibers with ordinary sizes (125 μm in diameter). Light-absorbing carbon-nanotube-polymer composites are efficiently dip-coated on the distal end of a multimode fiber for efficient ultrasound generation (maximal acoustic pressure: 0.95 MPa). All-fiber ultrasound probe is formed by pairing with a recently developed fiber-laser ultrasound sensor. The characterization result presents axial and lateral resolutions at 150 and 62 μm, respectively. The probe was applied in the ex vivo pulse-echo imaging of the cross-sectional structure of a swine trachea by linearly scanning the probe and detecting the scattered ultrasound waves. Taking advantage of the thin ultrasonic generating and receiving optical fibers, such an all-fiber ultrasound probe, may enable miniatured intravascular microendoscopy.
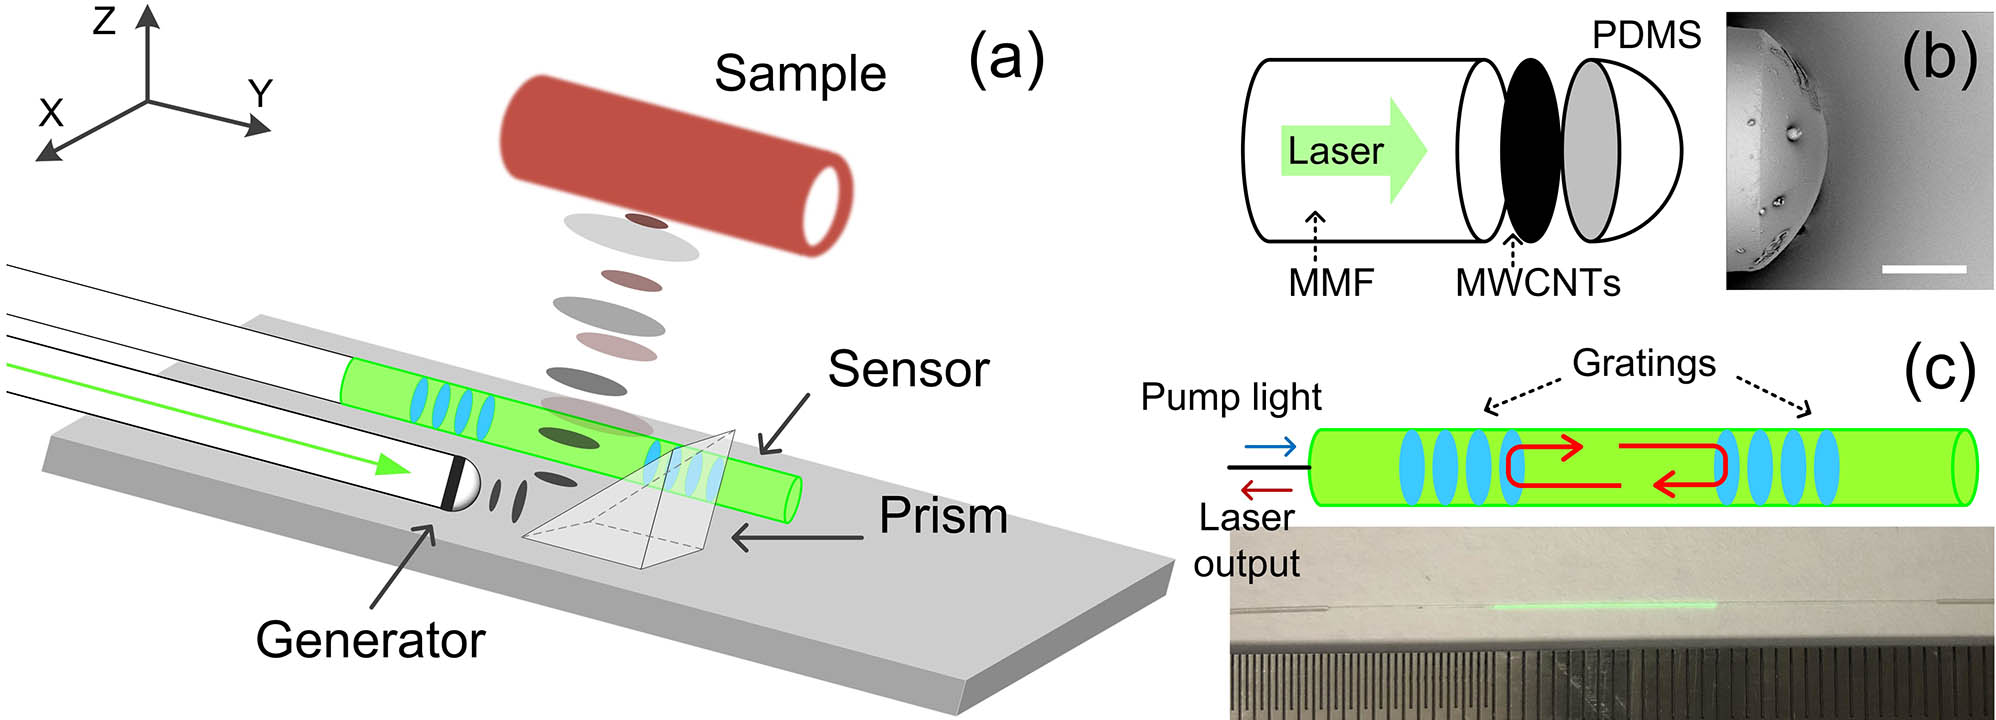
Figure 1(a) exhibits the all-fiber optical probe for ultrasound generation and detection. For ultrasound generation, a light-absorbing multiwalled carbon-nanotube (MWCNT) membrane is formed on the distal end of a step-indexed multimode fiber (SI2014-D, YOFC, China). The fiber core and cladding diameters are 105 and 125 μm, respectively. The functional overlay is fabricated as follows: 4 mg aminated MWCNT (XFM62, Yuanye Bio-Technology, China) with typical volumetric dimensions of 8 to 15 nm by 50 μm is added into 4 mL alcohol. The MWCNT suspension is sonicated for 1 with an ultrasonic oscillator at room temperature and then centrifuged at a rate 6000 r/min for 10 min, followed by removing the supernatant with a pipette to obtain a stable alcohol dispersion[21]. A cleaved optical fiber is functionalized by immersing it into a piranha solution for 30 min to hydroxylate its surface and then soaking into deionized water for 5 min to rinse off the residual piranha solution. The functionalized fiber is immersed into the alcohol dispersion of MWCNTs for about 8 h. The strong interaction between hydroxyl and amino groups can accelerate MWCNT adsorption on the fiber surface. The fiber is then suspended in air for for alcohol solvent evaporation, then dipped in polydimethylsiloxane (PDMS) (SYLGARD184, Dow Corning) for 10 s, which had been mixed with a curing elastomer (∶ in volume ratio), and then cured for 3 h in a thermostatic oven at 90°C. Figure 1(b) shows the structure and scanning electron microscope (SEM) image of the fiber-optic ultrasound generator. The dome-shaped PDMS coating has a thickness of 34 μm. A 532 nm nanosecond pulsed laser (SPOT-10-200-532; Elforlight, UK; pulse width: 1 ns; repetition rate: 1 kHz) is used to excite ultrasound signals at the composite coating. The intensity of the pulsed laser is attenuated with a variable neutral density filter before being coupled to the multimode fiber by using a collimator (F220FC-532, Thorlabs).
Sign up for Chinese Optics Letters TOC. Get the latest issue of Chinese Optics Letters delivered right to you!Sign up now
Figure 1.(a) Schematic of the all-fiber ultrasound probe. The probe generates ultrasound pulses and detects pulse-echo signals to have an A-line. It scans transversely (along the axis) to form a 2D image (B-scan). (b) A schematic and SEM image of the fiber-end-face ultrasound generator. (c) A schematic and photograph of the fiber-laser ultrasound sensor. The fiber segment emitting green fluorescent light is the Er/Yb-codoped fiber. It contains a laser cavity defined by two wavelength-matched Bragg reflectors.
The ultrasound generator is paired with a fiber-laser-based ultrasound sensor to detect the scattered sound waves. Figure 1(c) shows the acoustic sensing element, which incorporates two highly reflective Bragg reflectors at 1550 nm in a rare-earth-doped fiber (EY-305, Coractive) to form a laser cavity. The effective cavity length is about 8 mm, which guarantees a single-longitudinal-mode laser output. Pumped with a 980 nm semiconductor laser at 100 mW, the cavity offers a lasing output at 1 mW. The fiber has a weak intrinsic birefringence, yielding slightly different frequencies at the and polarizations. These orthogonal lasing modes beat with each other after passing through a 45° oriented polarizer and a beat signal at about 2.0 GHz is detected by a photodetector. An isolator was used to prevent unwanted end-face reflection or scattering. Ultrasound detection using the fiber laser was described in our previous reports[20]. Briefly, the incident ultrasound wave compresses the fiber and induces a birefringence change. As a result, the laser is frequency modulated, which outputs as a detectable frequency change of the beat signal.
The ultrasound generator and sensor are mounted parallelly to form an all-fiber probe. A triangular prism () is used for deflection of the acoustic beam. The separation between the ultrasound generating and receiving fibers is about 2 mm and is limited by the size of the prism. The fibers and the prism are fixed on a polyvinyl chloride (PVC) plate of a size of (). The probe will be further packaged and minimized toward endoscopic imaging. Non-directional ultrasound waves are generated at the fiber end face, reflected by the prism, and incident onto the specimen. The ultrasound waves are partially scattered off the acoustic contrasts and the pulse-echo signals are detected by the sensor as an A-line. Note that the sensitivity of the fiber sensor has a dependence, where denotes the angle between the fiber principal axis and the incident ultrasound waves. The orientation of the fiber sensor is rotated for sensitivity maximization. The relative locations of the components have been optimized for the same purpose. To have a two-dimensional (2D) ultrasound image, the probe transversely scanned along the axis using a motorized linear stage with a step size of 5 μm and recorded A-lines at each position. The ultrasonically induced frequency modulation was acquired by a vector signal analyzer (Pxie-5646R, National Instruments) with a sampling rate of 100 MHz. A field-programmable gate array card (Pxi-7852R, National Instruments) synchronizes the laser pulses, the motorized scanner as well as the data acquisition.
Prior to image reconstruction, the recorded A-line raw data were processed for noise suppression, elimination of direct cross talk as well as attenuation compensation. Cross-talk artifacts inevitably appear as a result of the ultrasound waves directly transmitted to the sensor and reflected by the supporting components of the probe. To eliminate the cross talk, a moving average algorithm was performed over the adjacent 160 A-line locations. The average leaves only the invariant cross-talk signals. The effect of the cross talk is then removed by subtracting the averaged result. The acoustic attenuation is compensated by using , where denotes the A-line signals recorded at each source position and denotes the time gain exponent. 2D image reconstruction is performed based on the delay-and-sum algorithm[22,23]. In the imaging plane, the sample is regarded as a composition of assumingly omni-directional, point-like acoustic sources. The time over the acoustic path from source to detector is expressed as where , , and denote the locations of voxels in the image, the ultrasound generator, and sensor. Taking all acoustic sources from location 1 to into account, the image amplitude for each image location can be calculated by
The acoustic pressure induced by the optical ultrasound generator has been measured with a calibrated membrane hydrophone (HMB-0500, ONDA, 50 MHz) at a distance of 2 mm. The peak-to-peak acoustic pressure is measured as 0.95 MPa by reading from the A-line data exhibited in Fig. 2(a) when the light pulse energy is 2.46 μJ (with a corresponding fluence of at the fiber end face). Figure 2(b) shows the corresponding frequency spectrum, centered at 18.5 MHz with a bandwidth of 88%. The spectrum bandwidth is much narrower than the ideal case as a result of the PDMS coating, which induces a weak acoustic resonance. The bandwidth can be broadened by optimizing the chemical composition to minimize the difference in elasticity between the polymer and the surrounding medium. Nevertheless, the bandwidth of the acoustic source can match well with our fiber optic sensor. Figure 2(c) shows the output acoustic pressure as a function of the pulse energy. The strength of the output ultrasound waves varies almost proportionally with increasing pulse energy, until reaching the damage threshold. To characterize the performance of the ultrasound detection, we measured ultrasound signals reflected by a metal sample (a coin). Figures 2(d) and 2(e) exhibit the waveform and frequency response of the echo signal. The probe presents a response centered at 19.2 MHz and a 6 dB bandwidth of 91% of planar ultrasound waves. The response to planar ultrasound waves has been measured in our previous report, which presents a 6 noise-equivalent pressure (NEP) 43.6 Pa over a 50 MHz detection bandwidth[24]. The frequency response of the present all-fiber probe differs from the previous result as a result of the limited bandwidth of the generator as well as the divergence of the propagating ultrasound beam.
Figure 2.Acoustic characterization. (a) The recorded ultrasound signal and (b) its acoustic spectrum. (c) The measured acoustic pressure versus the light pulse energy. The ultrasound pressure significantly dropped at 2.5 μJ as a result of the damage of the absorptive medium. (d) The recorded echo signal. (e) The calculated frequency response.
As shown in Fig. 3(a), a wire phantom that consists of eight ordinary single-mode silica fibers was first imaged by using the all-fiber probe to characterize the performance of the probe. The sample fibers were fixed almost parallelly to each other as well as the probe fibers. The probe is placed 3 mm above the first layer of the phantom fibers. Both the probe and the phantom are submerged in water for acoustic coupling. The phantom fibers scatter off the incident ultrasound waves from the fiber optic generator as a result of the distinct difference in the elastic properties between silica and water. The scattered waves are detected by the fiber-laser sensor and recorded as A-line pulse-echo signals. These signals are recorded while linearly scanning the probe using the linear stage. Figure 3(b) shows the B-scan raw data, which consists of 2600 A-lines. A typical A-line pulse-echo signal at the position labeled by the dashed line is shown at the right side. In this result, the direct cross talk has been eliminated via signal averaging and the acoustic loss has been compensated. Figure 3(c) shows the reconstructed image of the wire phantom. All three layers can be clearly imaged, suggesting a penetration depth larger than 6 mm. In the zoomed-in result of a selected wire [Fig. 3(d)], a number of side lobes in the axial direction can be seen due to the limited bandwidth of the acoustic sensor. Figure 3(e) shows the reconstructed data for this scatterer along the axial and lateral directions, which suggest the corresponding spatial resolutions at 150 and 62 μm by measuring the full width at half-maximum (FWHM) of the lateral curve as well as the envelope of the axial curve. The envelope of the axial curve that contains a number of side lobes is used to estimate the axial resolution. The lateral resolution is calculated based on the synthetic aperture algorithm, which is analogous to conventional ultrasound pulse-echo imaging[23]. The difference between the lateral and axial resolutions is partially because of the frequency response of the phantom fibers and partially caused by the limited angle-of-view of the ultrasound sensor. The spatial resolution can be enhanced by reducing the fiber diameter via chemical etching to have a wider detection bandwidth.
Figure 3.Phantom result. (a) A schematic of imaging a wire phantom that consists of eight spatially assembled silica fibers by using a linearly scanning all-fiber probe. (b) The B-scan raw data as well as a typical A-line signal. (c) The reconstructed image. (d) The enlarged image of a selected phantom fiber. (e) Point spread curves along the lateral and axial (red and blue dashed lines) directions with the envelope of the axial curve.
We then image a segment of a swine tracheal tube ex vivo by using the all-fiber ultrasound probe. The outer and inner diameters of the trachea image are about 4 and 2 mm, respectively. Both ends of the tracheal tube are fixed on a thick PVC plate and the imaged segment is suspended in water. The ultrasound probe is placed 4 mm above the sample during mechanical scanning. The scanning takes only 3 s to form a 2D image. Figure 4(b) shows the reconstructed 2D image, which has a size of and a pixel number of , by using 1200 A-lines. In the image, the outer and inner boundaries can be resolved. The lower half presents a lower signal-to-noise ratio due to the acoustic loss. Notably, the left and right edges of the tube wall cannot be well resolved as a result of the limited vision angle of the sensor, which has been also observed with conventional piezoelectric transducers. The tracheal tube consists of three tissue layers that are significantly different in elasticity. The cartilaginous layer is a core layer to support the whole tube structure, which has a significantly higher stiffness. In a previous measurement, the Young’s modulus of the cartilage is about 1.3 MPa[25]. The outer layer of the trachea is a band of connective tissue that is loosely bound to nearby organs. The inner layer contains the respiratory mucosa and submucosa, which are also loose tissues. The brightness within the tube wall is a result of the echo signal generated at the boundary between the cartilage and the surrounding soft tissues. A 3D image was further obtained by repeating the scanning at different planes and a stack of 250 individual planes spaced 10 μm apart. Figure 4(c) shows the 3D volumetric image. The image has a voxel number of () and a size of .
Figure 4.Ex vivo ultrasound imaging of a section of the swine trachea. (a) A photograph of the sample with a 1 mm scaled ruler below. (b) The 2D image. Pixel numbers: . OW: outer wall; IW: inner wall. (c) A snapshot of a 3D volumetric image. Voxel numbers: . Dimensions of the spatial extent (labeled by the white box): .
In summary, we have demonstrated an all-fiber optic ultrasound probe for pulse-echo imaging. The probe consists of an ultrasound generator fabricated at the distal end of a multimode fiber with a carbon-nanotube coating. Ultrasound waves are generated by using a nanosecond pulsed laser via the photoacoustic effect. The generator is paired by a highly sensitive ultrasound sensor based on a fiber laser. Two- and three-dimensional images have been obtained by linearly scanning the probe, detecting and recording the pulse-echo signals, and reconstructing via the delay-and-sum method. An ex vivo image of a swine tracheal tube has been demonstrated, which presents the layered structure of the tracheal wall. The axial and lateral resolutions are 150 and 62 μm, respectively, characterized in a phantom result. The spatial resolution provided by the present probe is better than by the piezoelectric transducers in clinical applications but is not as good as the optical sensors based on Fabry–Perot cavities. The bandwidth is a result of mechanical resonance and is determined by the elastic contrast between the silica fiber and water. The resolution can be enhanced by using a thinner fiber sensor for a broader detection bandwidth. Notably, the fiber laser sensor presents a directional sensitivity that is described as a circumferential dependence. As a result, the vision angle (full angle at half maximum: 60°) affects the quality of the vertical structures in the image. We expect to address this issue by multiplexing one or more additive sensors for full angle coverage. The all-fiber structure offers an alternative strategy to develop a compact, small-sized, side-looking imaging modality. The ultimate aim of the work is to develop a miniatured, high-performance, multimodality endoscopy.