• Advanced Photonics
  • Vol. 2, Issue 1, 015001 (2020)
Qi Jin, Yiwen E, Shenghan Gao, and Xi-Cheng Zhang*
Author Affiliations
  • University of Rochester, The Institute of Optics, Rochester, New York, United States
  • show less
    DOI: 10.1117/1.AP.2.1.015001 Cite this Article Set citation alerts
    Qi Jin, Yiwen E, Shenghan Gao, Xi-Cheng Zhang. Preference of subpicosecond laser pulses for terahertz wave generation from liquids[J]. Advanced Photonics, 2020, 2(1): 015001 Copy Citation Text show less
    (a) Photograph of the water line produced by a syringe needle in a side view. The diameter of the water line is 260 μm. Its flowing velocity is 7 m/s along the y direction. The laser beam propagates in the z direction. The water line can be moved along the x direction by a translation stage. (b) THz peak fields with different x positions when the 260-μm diameter water line is crossing the laser focal point along the x direction. (c) THz waveforms at x=±90 μm in (b).
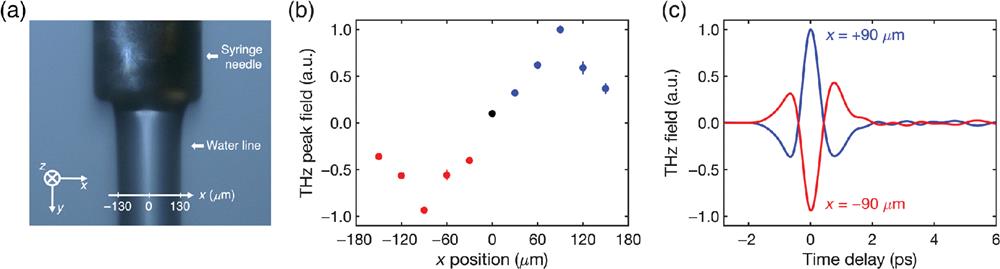
    Fig. 1. (a) Photograph of the water line produced by a syringe needle in a side view. The diameter of the water line is 260  μm. Its flowing velocity is 7  m/s along the y direction. The laser beam propagates in the z direction. The water line can be moved along the x direction by a translation stage. (b) THz peak fields with different x positions when the 260-μm diameter water line is crossing the laser focal point along the x direction. (c) THz waveforms at x=±90  μm in (b).
    Effect of optical pulse duration on THz energy and peak electron density for a 210-μm water line. The black dots are the experimental data for THz energy. The red curve is the simulation data for peak electron density.
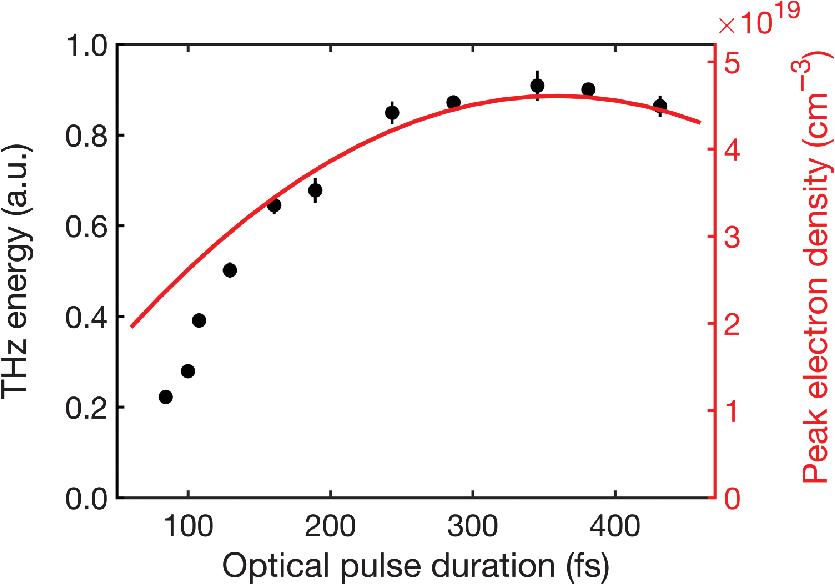
    Fig. 2. Effect of optical pulse duration on THz energy and peak electron density for a 210-μm water line. The black dots are the experimental data for THz energy. The red curve is the simulation data for peak electron density.
    Optimal optical pulse duration versus the diameter of the water line. The blue squares are simulations of optimal pulse duration aiming for highest electron density. The red dots are the experimental data obtained with strongest THz energy.
    Fig. 3. Optimal optical pulse duration versus the diameter of the water line. The blue squares are simulations of optimal pulse duration aiming for highest electron density. The red dots are the experimental data obtained with strongest THz energy.
    Comparison of THz radiation generated from α-pinene and water in (a) time domain and (b) frequency domain. Optical pulse durations are individually optimized for α-pinene and water. They have the same value of 345 fs. The diameter of the liquid line is 210 μm. Laser pulse energy is 0.4 mJ. The dash line in (b) is calculated by removing the absorption of α-pinene and adding the absorption of water to the black curve from 0.5 to 2.5 THz. Inset: measured results of refractive index n (dots) and field absorption coefficient α (circles) of α-pinene within 0.5 to 2.5 THz.
    Fig. 4. Comparison of THz radiation generated from α-pinene and water in (a) time domain and (b) frequency domain. Optical pulse durations are individually optimized for α-pinene and water. They have the same value of 345 fs. The diameter of the liquid line is 210  μm. Laser pulse energy is 0.4 mJ. The dash line in (b) is calculated by removing the absorption of α-pinene and adding the absorption of water to the black curve from 0.5 to 2.5 THz. Inset: measured results of refractive index n (dots) and field absorption coefficient α (circles) of α-pinene within 0.5 to 2.5 THz.
    Qi Jin, Yiwen E, Shenghan Gao, Xi-Cheng Zhang. Preference of subpicosecond laser pulses for terahertz wave generation from liquids[J]. Advanced Photonics, 2020, 2(1): 015001
    Download Citation