
Vinod Karar, Divya Agrawal, Smarajit Ghosh. Intuitive approach towards detection of attention tunneling while using a head-up display[J]. Chinese Optics Letters, 2015, 13(8): 081201
- Chinese Optics Letters
- Vol. 13, Issue 8, 081201 (2015)
Abstract
Head-up display (HUD) plays a crucial role in establishing an optimal control of aircraft by providing a collimated symbology/image superimposed on the outside world, seen on a semi-reflective transparent glass. This enables reduction in scanning and re-accommodation required to process near and far domain information at the same time. Significant benefits of HUD come at the cost of distribution of the pilot’s near and far domain attentional resources. This phenomenon is termed attention or cognitive capture. A few factors which play roles in attention tunneling are location of symbology reticles, symbology clutter, Mandelbaum effect, symbology format, size misconception, binocular misalignment, spatial location and disorientation, limited field-of-view, luminance, identical color and focal distance during symbology overlaid on an infrared raster image, accommodation and convergence, and so on[
HUDs generally provide displays in green color, whereas the outside world has hues of various saturations. A HUD displays characteristics such as feature salience, contrast interference, and contrast or luminance differences between various display elements also play a significant role in deciding the response time of the pilot[
To automatically detect attention tunneling and help in improving the SA of the pilot, it is important to analyze the real-time situation. This could be achieved by analyzing the HUD charge-coupled device (CCD) camera output video as the HUD camera captures the exact scene which is being viewed by the pilot during flight. In this work, the HUD camera-captured composite image comprising the outside world and symbology has been used for texture analysis and further classification purposes.
Sign up for Chinese Optics Letters TOC. Get the latest issue of Chinese Optics Letters delivered right to you!Sign up now
Any image can be characterized by its primitives such as color, shape, and texture. Tuceryan and Jain in their book chapter about texture analysis have mentioned “…the ‘definition’ of texture is formulated by different people depending upon the particular application and that there is no generally agreed upon definition…”[
Texture is one of the significant characteristics used to classify regions of interest or objects in an image[
The composite image captured by a HUD camera can be very complex. Its texture analysis could reveal discriminating features necessary to classify tunneled and nontunneled operation. Texture possesses important information about the structural arrangement of surfaces and their relationship to the surrounding environment. Image texture can be characterized through descriptors such as autocorrelation, directionality, central moments, coarseness, and so on.
The texture analysis has been utilized in this work to characterize regions in the images by their texture content. Various texture features can be extracted using co-occurrence probabilities through the gray-level co-occurrence matrix (GLCM). The GLCM, a statistical method of exploring texture, takes into consideration the spatial relationship of pixels. The analysis was performed using the image processing toolbox of MATLAB[
The outside world view captured by the HUD camera is with continuous gray levels and may have varying intensities and contrast throughout the scene, whereas the stroke form symbology has the same luminance throughout. The luminance and contrast patterns of the symbology play an important role in maintaining adequate contrast against varying backgrounds.
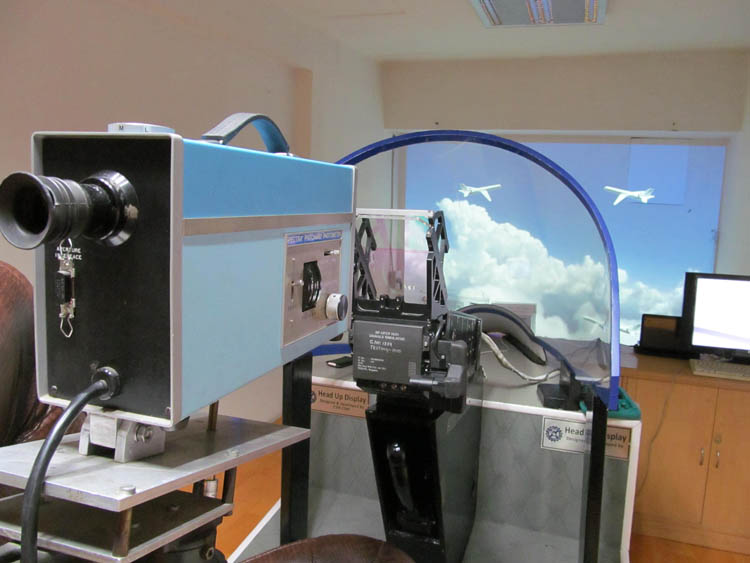
An experimental setup was established to simulate the flying conditions encountered by a pilot during flight. A real-time data logging system was also developed to capture a composite HUD video. This video stream was then used to extract features which were used as inputs for the fuzzy inference system (FIS)-based decision making to detect attention tunneling. A FIS-based inference mechanism was used to reap the benefits of both image processing and the intuitive experience of the users. Fuzzy inference is a very efficient tool which helps in translation of supervisor experience into a set of rules for efficient desired operation.
The experimental setup (Fig.
![]()
Figure 1.Experimental setup.
Our work was conducted over all the three ranges of ambient luminance (AL): high AL (
The programmability feature of the HUD signal simulator enabled generation of various symbology frames. Changes in the symbology field included: (1) horizon line, (2) airspeed, (3) heading scale, (4) mach number, (5) angle of attack, (6) vertical velocity, and (7) instantaneous velocity vector, as shown in Fig.
![]()
Figure 2.(a) Outside world view with markers; (b) HUD symbology page.
During the experimentation, the outside scene was simulated through pre-recorded scenes which covered various background conditions. The idea was to obtain maximum variation in background texture, luminance, and the contrast levels. Also, in outside scenery, different symbols (which includes up arrow, down arrow, quad arrow, cylindrical shape, and so on) kept appearing and disappearing for checking awareness of the user about outside scenery shown in Fig.
All these together created experimental conditions required to obtain HUD image conditions where the responses of participants could be evaluated under nontunneled operation (optimum; pilot able to optimally adjust his/her attention to both the outside as well as on the HUD display events) and tunneled operation (pilot either engrossed too much with HUD display or on the outside environment). Thus, the dynamic nature of outside scene, symbology, and varying AL and SL facilitated creation of a wide range of display conditions necessary to understand tunneling aspects and subsequent application of fuzzy inference on the data obtained.
Each participant was required to answer questions for the same setting and two sets of readings were recorded. Questions were asked during the time when the participant was looking through the HUD and focusing on the outside scene as well as the symbology. A total of 16 event changes (nine in outside scene and seven on symbology page as depicted in Fig.
![]()
Figure 3.HUD and outside event detection during different AL conditions and varying CR.
The recorded composite HUD videos were then further used to extract and generate an image data set. Generated image data set was saved and processed (Fig.
![]()
Figure 4.(a) Real-time image processing system developed for HUD image capturing and data logging; (b) example image frames extracted.
The aim here was to extract features from the classified image dataset which could help in translating the subjective knowledge obtained from visual inspection about classification of attention tunneling into an automatic detection scheme.
The composite image extracted from a composite HUD video can be very complex. The luminance and contrast patterns of the symbology play an important role in maintaining adequate contrast against varying backgrounds. Image frames extracted from the captured composite HUD videos were used as the input image. This image is converted to gray scale and the GLCM calculation is performed. The GLCM properties are extracted using the graycoprops function. The GLCM is a second-order texture measure. Different GLCM parameters are related to specific first-order statistical parameters. Association of a textural meaning to each of these parameters is very critical. The GLCM is dimensioned to number of gray levels. It stores the co-occurrence probabilities
An algorithm was developed using the MATLAB platform to analyze the texture features of all three sets of HUD camera-captured images. A MATLAB run was made to calculate all six parameters for each image dataset. An attempt was made to evolve a pattern which could be used to classify HUD image conditions in terms of tunneled or nontunneled cases objectively. Obtained parameter values are shown in Figs.
![]()
Figure 5.(a) Contrast; (b) correlation; (c) energy; (d) homogeneity, statistical parameters; (e) standard deviation; (f) entropy. Series 1, trend for HUD images with low symbol salience; Series 2, nontunneled operation; Series 3, trend for HUD images with high symbol salience.
Blue lines (Series 1) in Figs.
Other three parameters, viz., energy, entropy, and standard deviation, do not reveal any meaningful information regarding attention capture or symbology salience. Thus, luminance contrast between a pixel and its neighbor over the entre image, gray tone differences in pair elements, and gray tone linear dependencies in a HUD image indicated by these parameters could answer the question regarding the need to lower or increase the SL to mitigate tunneling and optimize the attention capture.
Analysis of Fig.
Each input was divided into three membership functions (MFs) each, i.e., low, medium, and high. For contrast (0.02–0.23) and correlation (0.89–0.99), a trapezoidal-shaped MF was selected while for homogeneity (0.94–0.99) a triangular-shaped MF was selected (Fig.
![]()
Figure 6.Input MF.
Here our aim was to make a distinction between the three cases: (1) tunneling due to low symbol salience, (2) nontunneled operation, and (3) tunneling due to high symbol salience. A Sugeno-type fuzzy model was chosen in this work as in case of Sugeno fuzzy model output is a linear or constant. In our case output is a linear value which represents: (a) ‘0’ for tunneling due to low symbol salience, (b) ‘0.5’ for nontunneled operation, and (c) ‘1’ for tunneling due to high symbol salience.
For a FIS to make correct decision, a total of 27 (
![]()
Figure 7.Rules of FIS for detection of attention tunneling.
Finally, a graphical user interface (GUI) was built using the MATLAB platform which incorporates the proposed FIS. It takes continuous composite HUD video as input, generates alerts for both types of tunneling cases, and also displays a normal operation message when no tunneling is taking place (Fig.
![]()
Figure 8.Working of FIS-based attention tunneling detection system.
Trials were conducted to test the developed GUI. In the trials, participants were asked to observe HUD symbology while a record of alerts generated by the FIS was maintained simultaneously. Scores were given to participants for correct identification of events occurring both in the foreground and background. Participant scores of identification revealed the information about when they got more focused on HUD symbology and less on the outside scene, or vice-versa, or a nontunneled performance. The subjective results were found to be in agreement with the alerts generated by the developed FIS system for attention tunneling detection. The scores obtained by the participants and corresponding alerts generated by the detection system are as tabulated in Table
| AL ( | CR | HUD Event Detection (%) | Outside Event Detection (%) | Alert Generated |
|---|---|---|---|---|
| 30,000 | 1.016 | 54 | 98 | T-LSL |
| 20,000 | 1.275 | 66 | 96 | T-LSL |
| 5,000 | 2.5 | 80 | 94 | NT |
| 1,000 | 1.1 | 56 | 98 | T-LSL |
| 500 | 2 | 82 | 95 | NT |
| 500 | 10 | 98 | 75 | T-HSL |
| 100 | 1.1 | 56 | 98 | T-LSL |
| 50 | 2.5 | 87 | 94 | NT |
| 50 | 13.8 | 98 | 70 | T-HSL |
Table 1. Sample of Participant Score and Corresponding Alerts Generated by Our FIS-Based Detection System
In conclusion, we report an intuitive approach of detecting attention tunneling while use of HUD in an aircraft. Texture features of HUD images are used by a FIS-based decision making system to identify tunneled or nontunneled HUD operation. Attention tunneling is detected until the present date using a subjective approach only, but this work opens new possibilities of automation in this field. The FIS-based system depending on feature values obtained by analysis of the HUD CCD camera video generates an alert with respect to attention tunneling. The system is of an assistive nature and it will make the pilot aware about the possibility of tunneling to be encountered. Also, real-time implementation of this technique will help in making use of a HUD, simpler further enhancing the pilot’s SA.
References
[1] C. D. Wickens. Attentional issues in head-up displays. Engineering Psychology and Cognitive Ergonomics, 1, 3(1997).
[2] J. Crawford, A. Neal. Int. J. Aviat. Psychol., 16, 1(2006).
[3] D. C. Foyle, R. S. McCann, B. D. Sanford, M. F. J. Schwirzke. 37th Meeting of the Human Factors and Ergonomics Society(1993).
[4] D. Cheng, Q. Wang, Y. Wang, G. Jin. Chin. Opt. Lett., 11, 31201(2013).
[5] C. Xu, D. Cheng, H. Peng, W. Song, Y. Wang. Chin. Opt. Lett., 12, 060011(2014).
[6] J. He. J. Ergon., 3, 1000e120(2013).
[7] M. R. Endsley. Human Factors, 37, 65(1995).
[8] M. Tuceryan, L. F. Pau, C. H. Chen, A. K. Jain, P. S. P. Wang. The Handbook of Pattern Recognition and Computer Vision, 207(1998).
[9] R. C. Gonzalez. Digital Image Processing(2009).
[10] . User’s Guide (R2013b)(2013).
[11] V. Karar, S. Ghosh. Chin. Opt. Lett., 12, 013301(2014).

Set citation alerts for the article
Please enter your email address
© Copyright 2018-2021 | Chinese Laser Press. All Rights Reserved 沪ICP备15018463号-20