
Bao-Jing Hu, Ming Huang, Peng Li, Jing-Jing Yang. Multiband plasmon-induced transparency based on nanometals-graphene hybrid model [J]. Acta Physica Sinica, 2020, 69(17): 174201-1
- Acta Physica Sinica
- Vol. 69, Issue 17, 174201-1 (2020)
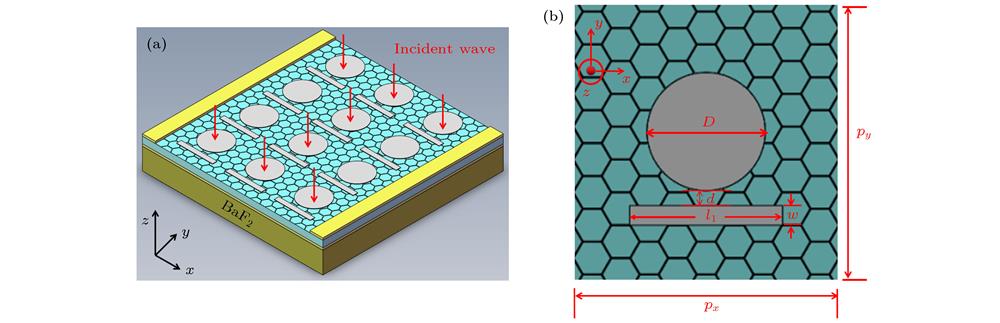
Fig. 1. Schematic diagrams of single-band PIT model: (a) Three-dimensional space schematic; (b) two-dimensional plane schematic.
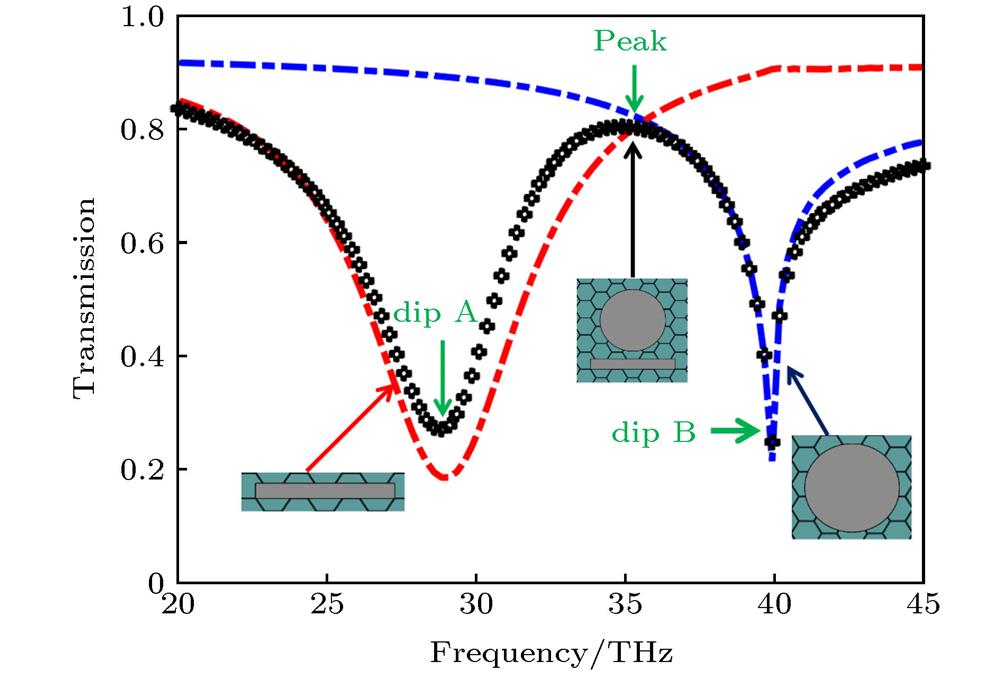
Fig. 2. Transmission spectra of the sole disks array, the sole rods array, and the single-band PIT model.
Fig. 3. Distributions of electric field of single-band PIT model at (a) dip A, (b) dip B, and (c) peak.
Fig. 4. Variations of resonant frequency and amplitude in transmission with frequency under different chemical potential of graphene in single-band PIT model.
Fig. 5. Comparisons of the PIT calculated by FDTD method and fitted by RTO model when chemical potential is 0 and 0.3 eV.
Fig. 6. Comparison of the PIT calculated by FDTD method and fitted by RTO model when chemical potential is 0.1 and 0.5 eV.
Fig. 7. (a) The fitting values of parameters in RTO model with the chemical potential of graphene varying from 0 to 0.5 eV; (b) new fitting result after introducing correction factor.
Fig. 8. Variations of transmission windows with different background materials in single-band PIT model.
Fig. 9. Variations of dip A, dip B, and peak with the different background materials in single-band PIT model.
Fig. 10. Two-dimensional plane schematic of dual-band PIT model.
Fig. 11. Transmission spectra of dual-band PIT model.
Fig. 12. Distributions of electric field of dual-band PIT model at (a) dip A, (b) dip B, (c) dip C, (d) peak I and (e) peak II.
Fig. 13. Variations of resonant frequency and amplitude in transmission with frequency under different chemical potential of graphene in dual-band PIT model.
Fig. 14. Two-dimensional plane schematic diagram of triple-band PIT model.
Fig. 15. Transmission spectra of triple-band PIT model.
Fig. 16. Distribution of electric field of triple-band PIT model at (a) dip A, (b) dip B, (c) dip C, (d) dip D, (e) peak I, (f) peak II and (g) peak III.
Fig. 17. Variations of resonant frequency and amplitude in transmission with frequency under different chemical potential of graphene in triple-band PIT model.


Set citation alerts for the article
Please enter your email address

© Copyright 2018-2021 | Chinese Laser Press. All Rights Reserved 沪ICP备15018463号-20