• Acta Physica Sinica
  • Vol. 69, Issue 2, 024205-1 (2020)
Xiao-Lu Li1、2, Ya Bai1、*, and Peng Liu1、3、*
Author Affiliations
  • 1State Key Laboratory of High Field Laser Physics, Shanghai Institute of Optics and Fine Mechanics, Chinese Academy of Sciences, Shanghai 201800, China
  • 2University of Chinese Academy of Sciences, Beijing 100049, China
  • 3Collaborative Innovation Center of IFSA (CICIFSA), Shanghai Jiao Tong University, Shanghai 200240, China
  • show less
    DOI: 10.7498/aps.69.20191200 Cite this Article
    Xiao-Lu Li, Ya Bai, Peng Liu. Control of the terahertz spectra generated from laser induced plasma[J]. Acta Physica Sinica, 2020, 69(2): 024205-1 Copy Citation Text show less
    Experimental setup.实验示意图
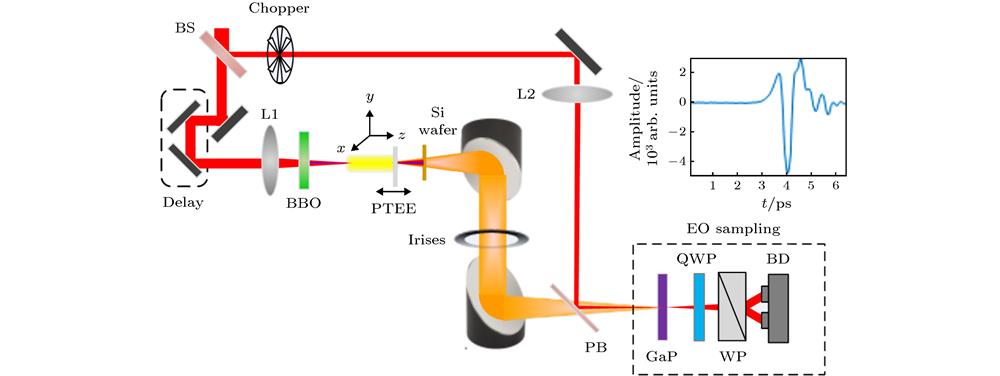
    Fig. 1. Experimental setup.实验示意图
    Measured (a) THz temporal waveforms and (b) normalized THz spectra at different pump power; (c) central frequencies as a function of the pump energy (The blue dots are the experimental results and the red solid line is from the simulation).当驱动光功率分别为25 GW (红色实线)及75 GW(蓝色点线)时实验测量的(a)时域光谱及(b)归一化频谱; (c) THz光谱的中心频率随着驱动光功率的变化(其中蓝色点图为实验结果图, 红色曲线为模拟结果)
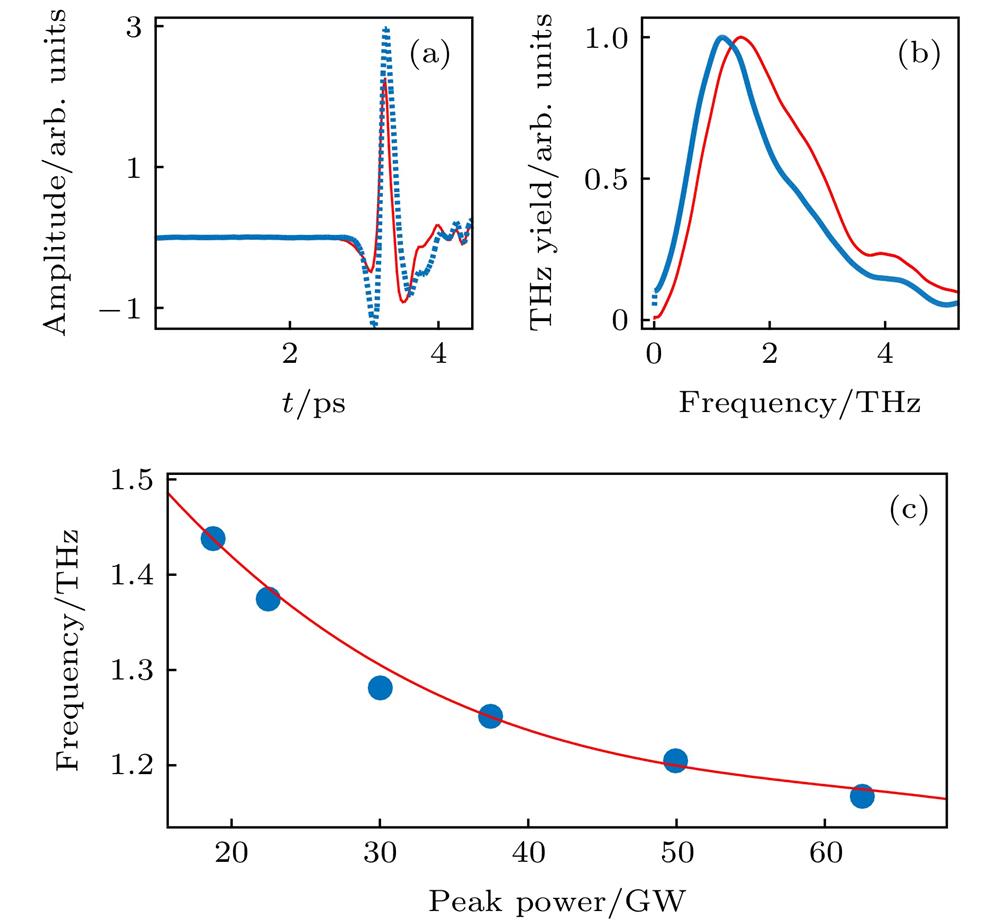
    Fig. 2. Measured (a) THz temporal waveforms and (b) normalized THz spectra at different pump power; (c) central frequencies as a function of the pump energy (The blue dots are the experimental results and the red solid line is from the simulation).当驱动光功率分别为25 GW (红色实线)及75 GW(蓝色点线)时实验测量的(a)时域光谱及(b)归一化频谱; (c) THz光谱的中心频率随着驱动光功率的变化(其中蓝色点图为实验结果图, 红色曲线为模拟结果)
    (a) Far-field THz profiles at different frequencies at the pump power of 45 GW; (b) THz central frequencies as a function of the pump energy at various emission angles (Dashed line with solid dots is the experimental results and the solid line is the simulation results)(a) 驱动光功率为45 GW时, 频率为1 THz与3 THz的辐射角分布; (b)不同锥形辐射角下, THz光谱的中心频率随着驱动光功率的变化 (虚线连接的实心点为实验结果, 实线为计算结果)
    Fig. 3. (a) Far-field THz profiles at different frequencies at the pump power of 45 GW; (b) THz central frequencies as a function of the pump energy at various emission angles (Dashed line with solid dots is the experimental results and the solid line is the simulation results)(a) 驱动光功率为45 GW时, 频率为1 THz与3 THz的辐射角分布; (b)不同锥形辐射角下, THz光谱的中心频率随着驱动光功率的变化 (虚线连接的实心点为实验结果, 实线为计算结果)
    Plasma frequency (blue solid line) and skin depth (red dot line) as a function of the (a) radial axis and (b) pro-pagation direction at the pump power of 25 GW.驱动光功率为25 GW 时 (a)沿激光传输方向中点处径向和(b)沿驱动光传输方向z的等离子体频率(蓝色实线)及趋肤深度(红色点线)
    Fig. 4. Plasma frequency (blue solid line) and skin depth (red dot line) as a function of the (a) radial axis and (b) pro-pagation direction at the pump power of 25 GW.驱动光功率为25 GW 时 (a)沿激光传输方向中点处径向和(b)沿驱动光传输方向z的等离子体频率(蓝色实线)及趋肤深度(红色点线)
    The simulated THz spectra at 25 and 75 GW pump power.当驱动光功率分别为25 GW和75 GW时模拟计算的归一化频谱
    Fig. 5. The simulated THz spectra at 25 and 75 GW pump power.当驱动光功率分别为25 GW和75 GW时模拟计算的归一化频谱
    THz central frequencies as a function of the plasma length (The blue dots are the experimental results and the red solid line is the simulation results).THz光谱的中心频率随着等离子体光丝长度的变化(蓝色点图为实验结果图, 红色曲线为模拟结果)
    Fig. 6. THz central frequencies as a function of the plasma length (The blue dots are the experimental results and the red solid line is the simulation results).THz光谱的中心频率随着等离子体光丝长度的变化(蓝色点图为实验结果图, 红色曲线为模拟结果)
    Xiao-Lu Li, Ya Bai, Peng Liu. Control of the terahertz spectra generated from laser induced plasma[J]. Acta Physica Sinica, 2020, 69(2): 024205-1
    Download Citation