• High Power Laser Science and Engineering
  • Vol. 7, Issue 2, 02000e25 (2019)
L. Volpe1、2、†,*, R. Fedosejevs3, G. Gatti1, J. A. Pérez-Hernández1, C. Méndez1, J. Apiñaniz1, X. Vaisseau1, C. Salgado1、4, M. Huault1、4, S. Malko1、4, G. Zeraouli1、4, V. Ospina1、4, A. Longman3, D. De Luis1, K. Li1, O. Varela1, E. García1, I. Hernández1, J. D. Pisonero1, J. García Ajates1, J. M. Alvarez1, C. García1, M. Rico1, D. Arana1, J. Hernández-Toro1, and L. Roso1、4
Author Affiliations
  • 1Centro de Laseres Pulsados (CLPU), Edicio M5. Parque Cientco. C/ Adaja, 8. 37185 Villamayor, Salamanca, Spain
  • 2Laser-Plasma Chair at the University of Salamanca, Salamanca, Spain
  • 3Department of Electrical and Computer Engineering, University of Alberta, Edmonton, Alberta T6G 2V4, Canada
  • 4University of Salamanca, Salamanca, Spain
  • show less
    DOI: 10.1017/hpl.2019.10 Cite this Article Set citation alerts
    L. Volpe, R. Fedosejevs, G. Gatti, J. A. Pérez-Hernández, C. Méndez, J. Apiñaniz, X. Vaisseau, C. Salgado, M. Huault, S. Malko, G. Zeraouli, V. Ospina, A. Longman, D. De Luis, K. Li, O. Varela, E. García, I. Hernández, J. D. Pisonero, J. García Ajates, J. M. Alvarez, C. García, M. Rico, D. Arana, J. Hernández-Toro, L. Roso. Generation of high energy laser-driven electron and proton sources with the 200 TW system VEGA 2 at the Centro de Laseres Pulsados[J]. High Power Laser Science and Engineering, 2019, 7(2): 02000e25 Copy Citation Text show less
    Schematic of the three VEGA systems.
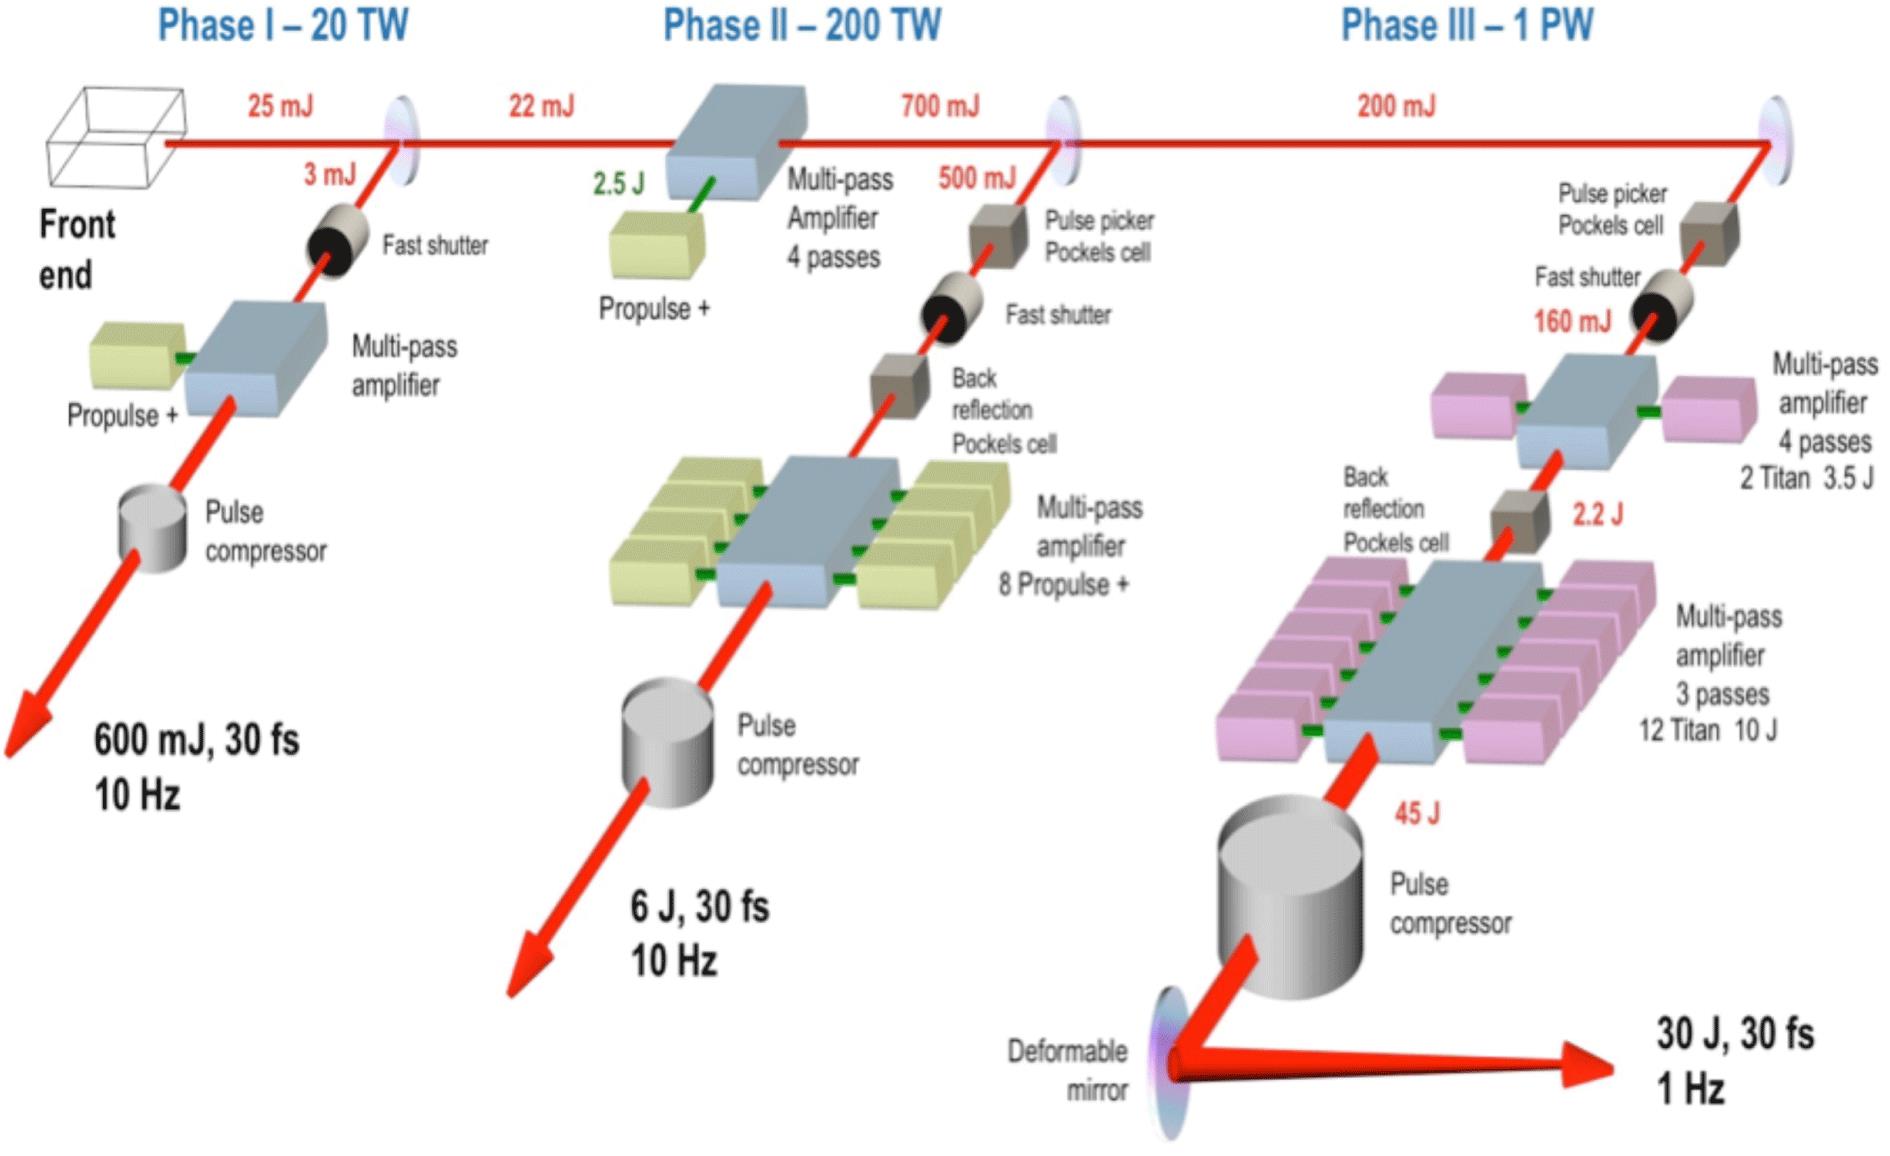
    Fig. 1. Schematic of the three VEGA systems.
    Contrast of VEGA 2, measured by Sequioa.
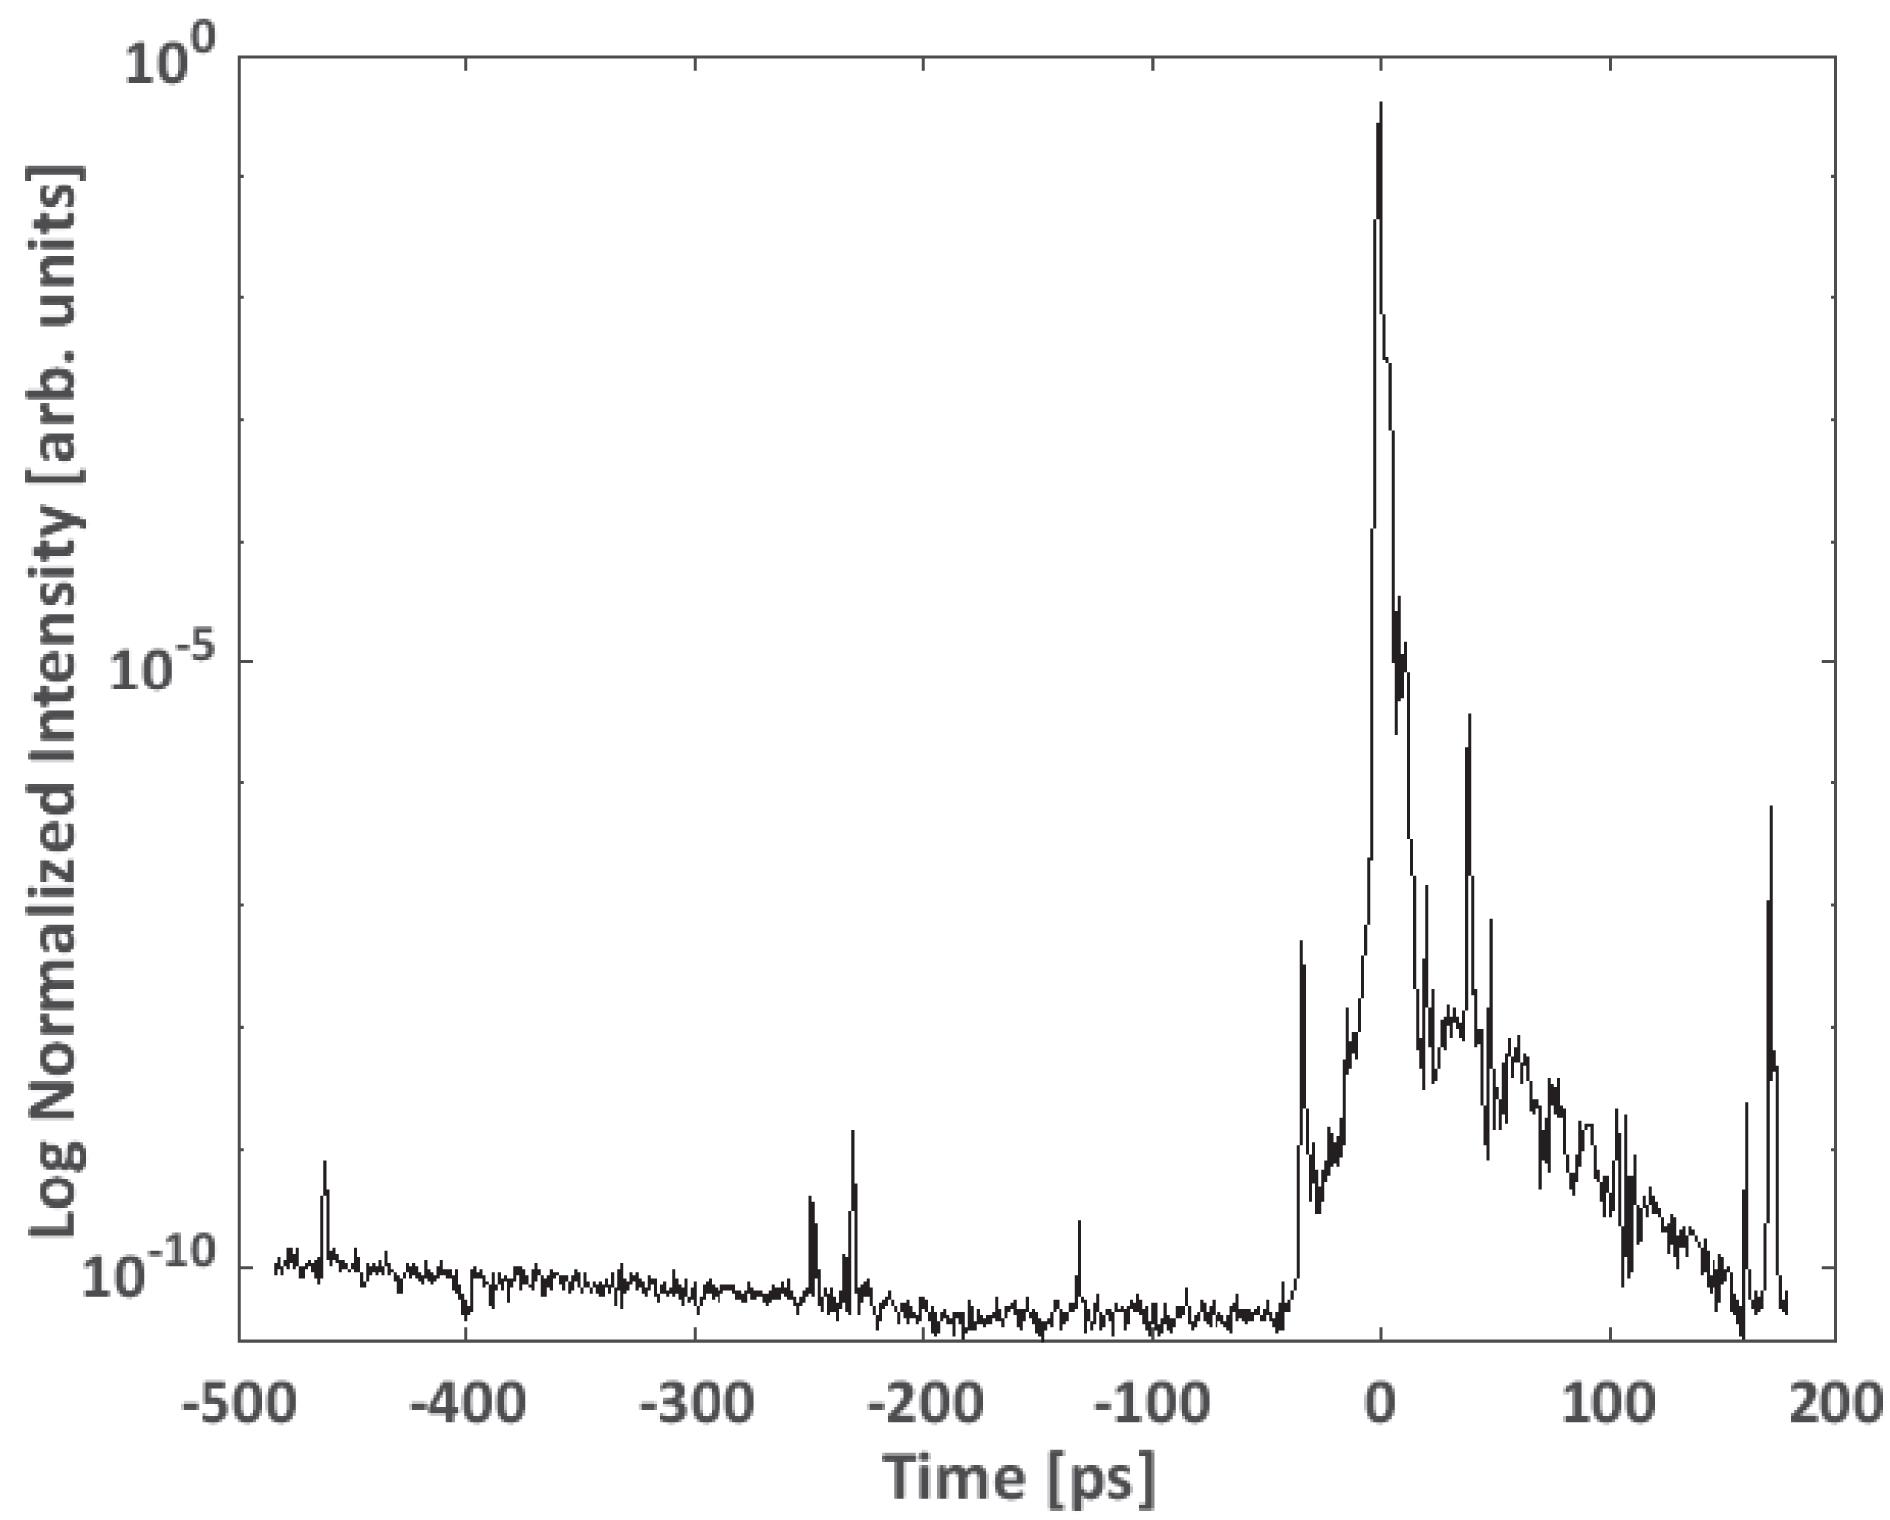
    Fig. 2. Contrast of VEGA 2, measured by Sequioa.
    Long focal experimental setup.
    Fig. 3. Long focal experimental setup.
    Typical broad electron spectrum measured with 1.2 Tesla magnetic spectrometer; inset: filtered image of measured electron energy spectrum.
    Fig. 4. Typical broad electron spectrum measured with 1.2 Tesla magnetic spectrometer; inset: filtered image of measured electron energy spectrum.
    Short focal experimental setup.
    Fig. 5. Short focal experimental setup.
    Normalized reflection of the probe at the target for different time delays with VEGA 2. Dotted lines are guides for eyes.
    Fig. 6. Normalized reflection of the probe at the target for different time delays with VEGA 2. Dotted lines are guides for eyes.
    RCF stack design and experimental results.
    Fig. 7. RCF stack design and experimental results.
    Proton spectrum obtained by both RCF (histogram) and ToF (continuous line) measurements for the same series of shots (by using special holed RCFs). Inset: example of typical proton spectrum obtained by ToF detection with maximum energy around 10 MeV.
    Fig. 8. Proton spectrum obtained by both RCF (histogram) and ToF (continuous line) measurements for the same series of shots (by using special holed RCFs). Inset: example of typical proton spectrum obtained by ToF detection with maximum energy around 10 MeV.
    Proton radiography of (starting from left) a piece of leaf, a wing, a metallic grid and a CLPU metallic logo. The final image of the logo appears in the first RCF layer to be in a 20 mm $\times$ 100 mm area which, according to the geometrical magnification $M\sim 4$, reproduces correctly the original dimensions of the logo which is 5 mm $\times$ 20 mm.
    Fig. 9. Proton radiography of (starting from left) a piece of leaf, a wing, a metallic grid and a CLPU metallic logo. The final image of the logo appears in the first RCF layer to be in a 20 mm $\times$ 100 mm area which, according to the geometrical magnification $M\sim 4$, reproduces correctly the original dimensions of the logo which is 5 mm $\times$ 20 mm.
    KB microscope setup. Inset (top right): image of the $K_{\text{alpha}}$ emission from fast electron beam travelling into the $6~\unicode[STIX]{x03BC}\text{m}$ Al target. Inset (bottom right): magnified radiography of a calibration grid.
    Fig. 10. KB microscope setup. Inset (top right): image of the $K_{\text{alpha}}$ emission from fast electron beam travelling into the $6~\unicode[STIX]{x03BC}\text{m}$ Al target. Inset (bottom right): magnified radiography of a calibration grid.
    Example of experimental data for different diagnostics in place: (red, diamond points) maximum proton energy from pin diode ToF measurement, (blue, star points) maximum proton energy from MCP TOF measurements, (orange, circle points) laser energy and (purple, triangle points) $K_{\text{alpha}}$ integrated signal from KB X-ray focusing system. The lines are guides for eyes.
    Fig. 11. Example of experimental data for different diagnostics in place: (red, diamond points) maximum proton energy from pin diode ToF measurement, (blue, star points) maximum proton energy from MCP TOF measurements, (orange, circle points) laser energy and (purple, triangle points) $K_{\text{alpha}}$ integrated signal from KB X-ray focusing system. The lines are guides for eyes.
    L. Volpe, R. Fedosejevs, G. Gatti, J. A. Pérez-Hernández, C. Méndez, J. Apiñaniz, X. Vaisseau, C. Salgado, M. Huault, S. Malko, G. Zeraouli, V. Ospina, A. Longman, D. De Luis, K. Li, O. Varela, E. García, I. Hernández, J. D. Pisonero, J. García Ajates, J. M. Alvarez, C. García, M. Rico, D. Arana, J. Hernández-Toro, L. Roso. Generation of high energy laser-driven electron and proton sources with the 200 TW system VEGA 2 at the Centro de Laseres Pulsados[J]. High Power Laser Science and Engineering, 2019, 7(2): 02000e25
    Download Citation