
Wan-Li Wei, Chun-Sheng Weng, Yu-Wen Wu, Quan Zheng. Experimental research on influence of turbine guide vane on propagation characteristics of rotating detonation wave [J]. Acta Physica Sinica, 2020, 69(6): 064703-1
- Acta Physica Sinica
- Vol. 69, Issue 6, 064703-1 (2020)
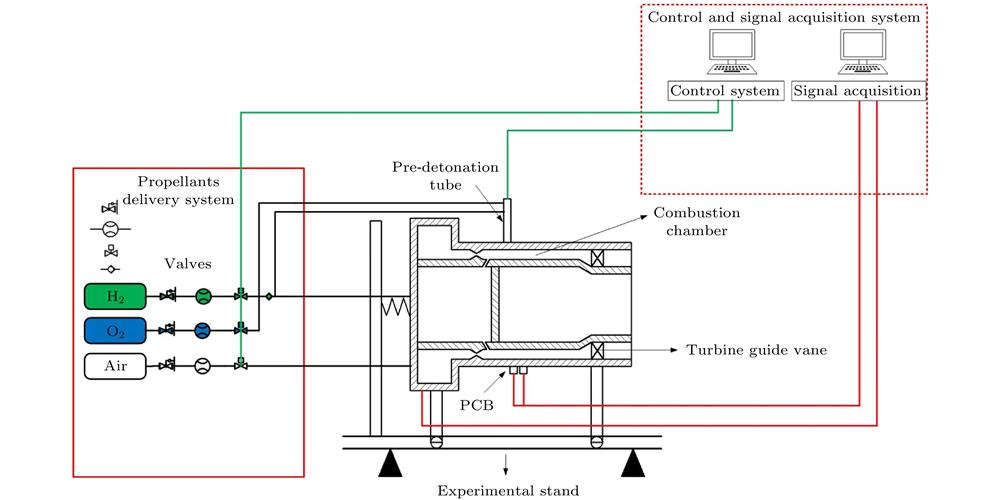
Fig. 1. Schematic diagram of the experiment system.
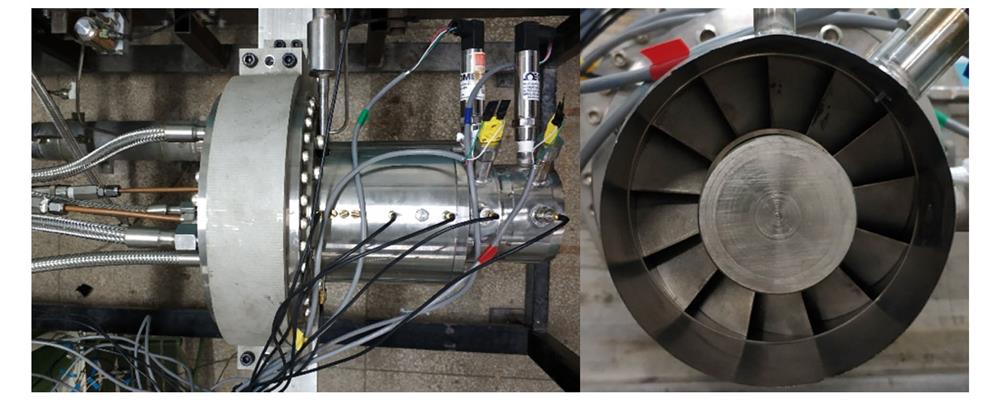
Fig. 2. Photograph of rotating detonation combustor and turbine guide vane.
Fig. 3. Locations of sensors.
Fig. 4. Experimental time sequence.
Fig. 5. Pressure trace of propellant manifolds in test 11.
Fig. 6. High-frequency pressure: (a) Global graph; (b) magnified results.
Fig. 7. Velocity-time distribution.
Fig. 8. Frequency domain analysis: (a) FFT results; (b) STFT results.
Fig. 9. High-frequency pressure of PCB1-PCB3.
Fig. 10. Pressure trace of propellant manifolds in test 5.
Fig. 11. Result analysis in test 5: (a) High-frequency pressure; (b) FFT results.
Fig. 12. Pressure trace of propellant manifolds in test 2.
Fig. 13. Result analysis in test 2: (a) High-frequency pressure; (b) FFT results.
Fig. 14. Average velocity and relative standard deviation of detonation wave.
Fig. 15. Analysis of upstream and downstream results of turbine guide vane: (a) High-frequency pressure and static pressure; (b) FFT results.
Fig. 16. Statistics of flow field parameters in upstream and downstream of turbine guide vane: (a) Frequency; (b) static pressure.
Fig. 17. Variation of static pressure and average peak pressure with equivalent ratio: (a) Static pressure; (b) average peak pressure.
|
Table 1. Test conditions.

Set citation alerts for the article
Please enter your email address
© Copyright 2018-2021 | Chinese Laser Press. All Rights Reserved 沪ICP备15018463号-20