
Guang-Yu Jiang, Chao Sun, Qin-Ran Li. Effect of mesoscale eddies on the vertical spatial characteristics of wind-generated noise in deep ocean [J]. Acta Physica Sinica, 2020, 69(14): 144301-1
- Acta Physica Sinica
- Vol. 69, Issue 14, 144301-1 (2020)
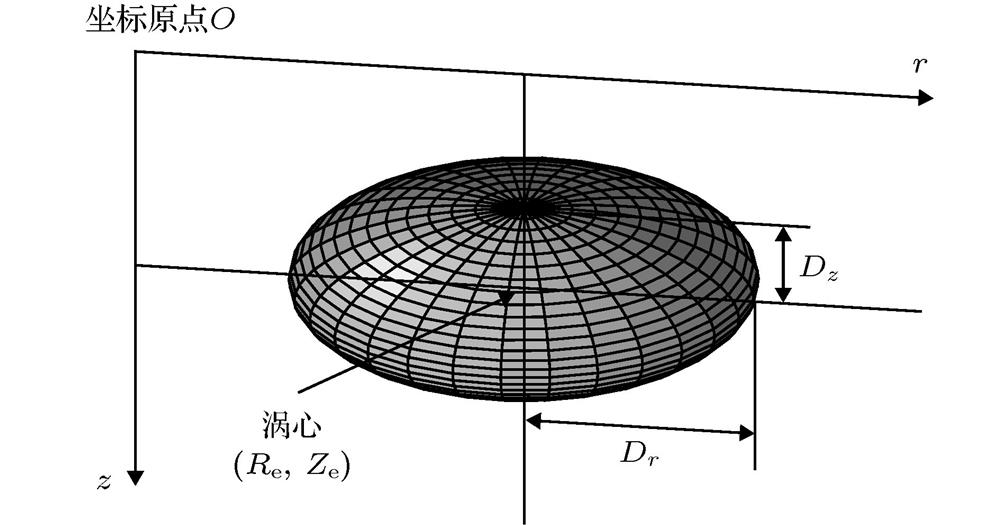
Fig. 1. Gaussian eddy model
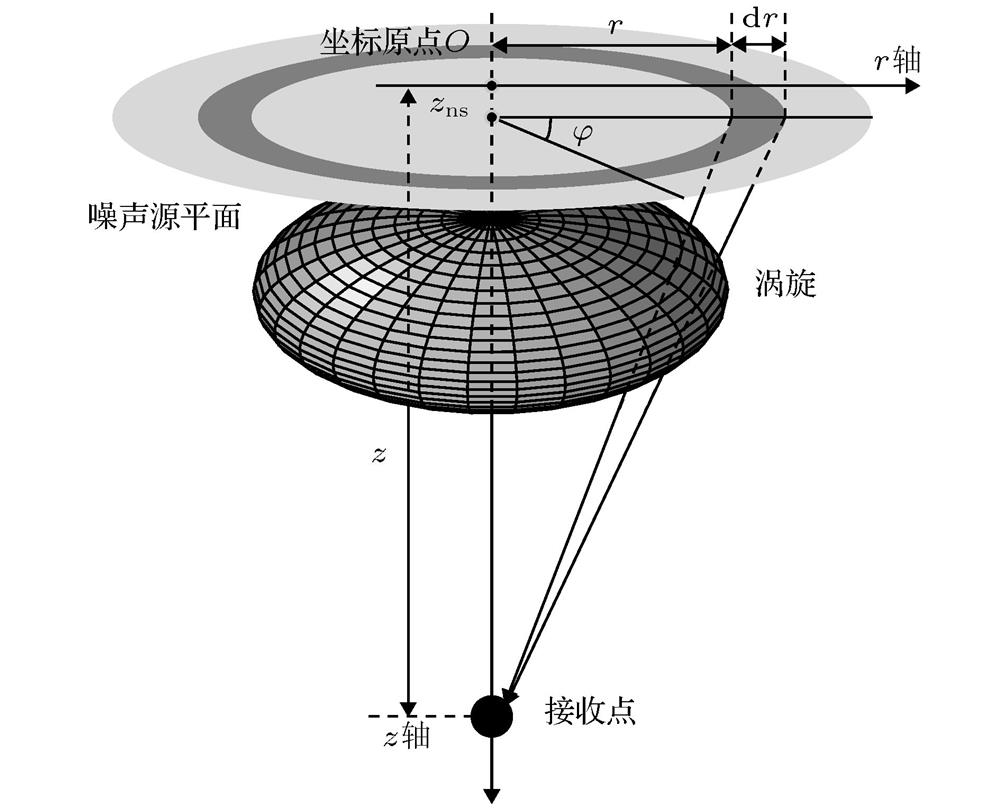
Fig. 2. Geometry of the noise model
Fig. 3. Simulation environment
Fig. 4. Sound speed distribution with different
 : (a)
: (a)
 ; (b)
; (b)
 ; (c)
; (c)
 ; (d)
; (d)
 ; (e)
; (e)

: (a)
; (b)
; (c)
; (d)
; (e)
Fig. 5. Noise vertical directionalities at different depths with different
 (black dashed line in each subfigure indicates the location of the peak at the downward edge of the horizontal notch): (a)
 ; (b)
; (b)
 ; (c)
; (c)
 ; (d)
; (d)
 ; (e)
; (e)

(black dashed line in each subfigure indicates the location of the peak at the downward edge of the horizontal notch): (a)
; (b)
; (c)
; (d)
; (e)
Fig. 6. Noise vertical directionalities with different
 at 800 and 2000 m depths: (a) 800 m; (b) 2000 m
at 800 and 2000 m depths: (a) 800 m; (b) 2000 m Fig. 7. Noise vertical correlation functions with different
 at 800 m depth: (a)
 ; (b)
; (b)

at 800 m depth: (a)
; (b)
Fig. 8. Noise vertical correlation functions with different
 at 2000 m depth: (a)
 ; (b)
; (b)

at 2000 m depth: (a)
; (b)
Fig. 9. Traces of the rays launching from the (0, 800 m) point with the launching polar angles varying within
 under the conditions where
 equals to 0,
 , and 40 (green dashed lines, red solid lines and gray dotted lines in each subfigure indicate the NR, SR, and SRBR rays, respectively): (a)
 0; (b)
 ; (c)
; (c)

under the conditions where
equals to 0,
, and 40 (green dashed lines, red solid lines and gray dotted lines in each subfigure indicate the NR, SR, and SRBR rays, respectively): (a)
0; (b)
; (c)
Fig. 10. Noise vertical noise directionalities
 generated by noise sources within
 at 800 m depth with
 r varying from 40 to 50 km under the conditions where
 equals to 0,
 , and 40: (a)
 ; (b)
; (b)
 ; (c)
; (c)

generated by noise sources within
at 800 m depth with equals to 0,
, and 40: (a)
; (b)
; (c)
Fig. 11. Traces of the rays launching from the (0, 2000 m) point with the launching polar angles varying within
 under the conditions where
 equals to 0,
 , and 40 (green dashed lines, red solid lines and gray dotted lines in each subfigure indicate the NR, SR, and SRBR rays, respectively): (a)
 ; (b)
; (b)
 ; (c)
; (c) D c = 40
under the conditions where
equals to 0,
, and 40 (green dashed lines, red solid lines and gray dotted lines in each subfigure indicate the NR, SR, and SRBR rays, respectively): (a)
; (b)
; (c) Fig. 12. Noise vertical noise directionalities
 generated by noise sources within
 at 2000 m depth with
 r varying from 40 to 50 km under the conditions where
 equals to 0,
 , and 40: (a)
 ; (b)
; (b)
 ; (c)
; (c)

generated by noise sources within
at 2000 m depth with equals to 0,
, and 40: (a)
; (b)
; (c)
Fig. 13. Downward-view geometry
Fig. 14. Sound distribution in the 800 m depth cross section
Fig. 15. Transmission loss from
 800 m depth to the noise sources depth (0.5 m) cross section computed by the Bellhop3D program in
 and 3D modes: (a)
 N × 2D; (b) 3D
800 m depth to the noise sources depth (0.5 m) cross section computed by the Bellhop3D program in
and 3D modes: (a) Fig. 16. Noise vertical directionalities at the off-center position 800 m depth generated by the noise sources within sector 1 and sector 2 in comparison with the noise vertical directionality at the eddy center 800 m depth
|
Table 1. Minimal lunching polar angle
 , maximal launching polar angle
 , central launching polar angle
 , and launching polar angle width
 of the SR rays launching from the (0, 800 m) point with the launching polar angle being greater than
 under the conditions where
 equals to 0,
 , and 40
, maximal launching polar angle
, central launching polar angle
, and launching polar angle width
of the SR rays launching from the (0, 800 m) point with the launching polar angle being greater than
under the conditions where
equals to 0,
, and 40
|
Table 2. Minimal launching polar angle
 , maximal launching polar angle
 , central launching polar angle
 , and launching polar angle width
 of the SR rays launching from the (0, 2000 m) point with the launching polar angle being greater than
 under the conditions where
 equals to 0,
 , and 40
, maximal launching polar angle
, central launching polar angle
, and launching polar angle width
of the SR rays launching from the (0, 2000 m) point with the launching polar angle being greater than
under the conditions where
equals to 0,
, and 40 

Set citation alerts for the article
Please enter your email address

© Copyright 2018-2021 | Chinese Laser Press. All Rights Reserved 沪ICP备15018463号-20