
Xiang LIU, Lihua ZHANG, Zeyuan DAI, Qiu CHEN, Yinfei ZHOU. A Parameter-free Denoising Method for ICESat-2 Point Cloud Under Strong Noise[J]. Acta Photonica Sinica, 2022, 51(11): 1110002
- Acta Photonica Sinica
- Vol. 51, Issue 11, 1110002 (2022)
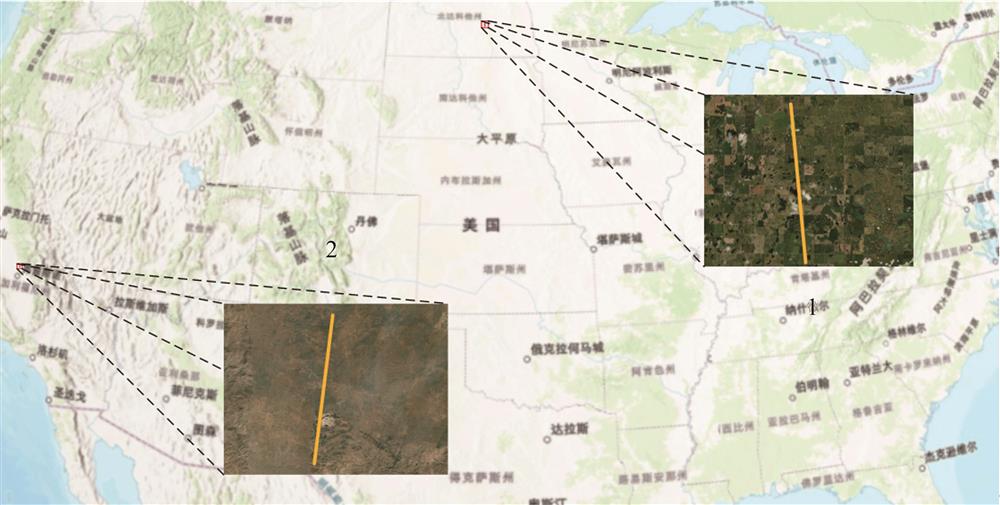
Fig. 1. Location of study area and distribution of data
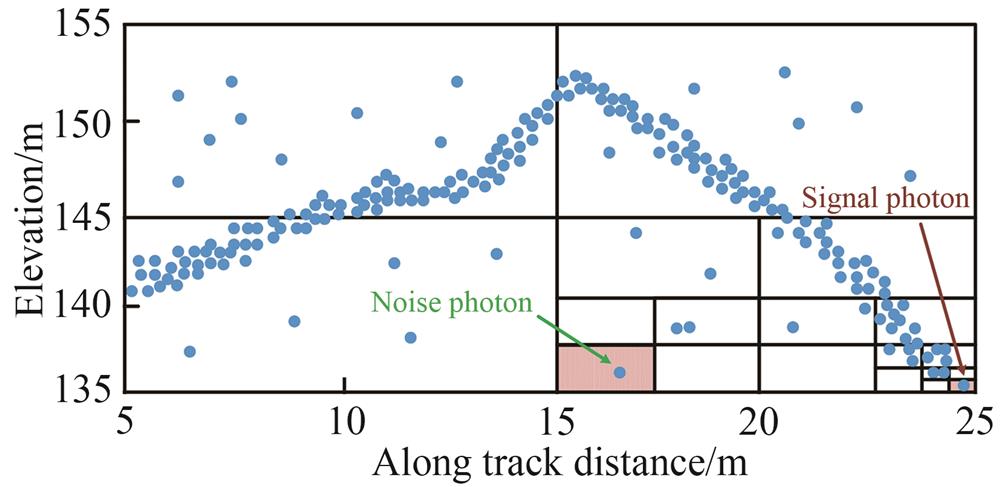
Fig. 2. Photons separated by quadtree
Fig. 3. Tree structure of photons separated by quadtree
Fig. 4. Photons incorrectly separated by quadtree
Fig. 5. Tree structure of photons incorrectly separated by quadtree
Fig. 6. Photons separated by pruned quadtree
Fig. 7. Tree structure of photons separated by pruned quadtree
Fig. 8. Outlier detection by box-plot
Fig. 9. Initial point cloud in study area 1
Fig. 10. Initial point cloud in study area 2
Fig. 11. Denoising result of quadtree method in study area1
Fig. 12. Denoising result of pruned quadtree method in study area1
Fig. 13. Denoising result of quadtree method and second-level denoising in study area 1
Fig. 14. Denoising result of pruned quadtree method and second-level denoising in study area 1
Fig. 15. Ground curves in study area 1
Fig. 16. Denoising result of quadtree method in study area 2
Fig. 17. Denoising result of pruned quadtree method in study area 2
Fig. 18. Denoising result of quadtree method and second-level denoising in study area 2
Fig. 19. Denoising result of pruned quadtree method and second-level denoising in study area 2
Fig. 20. Canopy top curves in study area 2
Fig. 21. Ground curves in study area 2
|
Table 1. Ground accuracy evaluation in study area 1
|
Table 2. Canopy top accuracy evaluation in study area 2
|
Table 3. Ground accuracy evaluation in study area 2

Set citation alerts for the article
Please enter your email address
© Copyright 2018-2021 | Chinese Laser Press. All Rights Reserved 沪ICP备15018463号-20