
Biao WANG, Yi-Wei HUO, Xing GUO, Jia-Ji WU. Relationship between radar reflectivity factor and ice water content of non-spherical cirrus ice crystals at 220 GHz[J]. Journal of Infrared and Millimeter Waves, 2022, 41(5): 850
- Journal of Infrared and Millimeter Waves
- Vol. 41, Issue 5, 850 (2022)
Abstract
Introduction
Cirrus is a critical factor of global radiation balance and is one of the primary sources of uncertainty in satellite inversion and climate model research. The scattering of light by ice crystals not only has effect on the radiation balance of the Earth-atmosphere system but also plays a significant role in the development of many small-scale and even weather-scale precipitation in the middle and high latitudes. Millimeter-wave radars can examine the physical structure,dynamic and small-scale turbulence of clouds,ice water content and recognize ice clouds and water clouds.Cloud radar on CloudSat at 94 GHz can be used to study internal horizontal and vertical structure of cloud[
Remote sensing of cloud can be divided into active and passive modes,including microwave radar,microwave radiometer,Lidar et al. The information of cloud top and cloud water path can be obtained by the microwave radiometer. Microwave radar,suitable for detecting cloud particles with a diameter of more than 100 microns,can be utilized to obtain cloud vertical structure information. Lidars can detect tiny particles on a micron- scale;however,it can only receive cloud surface information because of its insufficient cloud penetration ability. Terahertz waves lie between the microwave and infrared waves. The terahertz waves are in the Mie scattering region for the large cloud particles,whereas they are in the Rayleigh scattering region for the small cloud particles. As is known,the backscattering of the cloud particles in the Rayleigh scattering region is inversely proportional to the fourth power of the detection wavelength. Thus,the smaller cloud particles have stronger scattering to the terahertz wave. The backscattering of particles in the Mie scattering region is stronger than that in the Rayleigh scattering region. In addition,the study of Hogan at the University of Reading in the United Kingdom shows that low-frequency terahertz waves have great potential for the detection of ice clouds in the atmosphere(mostly 5 to 10 microns in diameter)[
The terahertz cloud radar utilizes the scattering characteristics of cloud particles on electromagnetic waves. By the analysis of the radar echo the cloud which reflects the macroscopic and microscopic structure of the cloud,we can understand the various characteristics of the cloud. The reflectivity factor values of the cloud can be estimated by measuring the echo intensity,and further,the information of the ice water content and particle size of the cloud. Combined with other observation methods,such as microwave radiometers to measure temperature,humidity,and additional information,more advanced meteorological products can be produced.
In 2012,Leinonen proposed that idealized homogeneous spheroidal models of ice crystals and snowflakes cannot consistently describe radar backscattering from a snowfall when the radar wavelengths are on the order of the snowflake size by analyzing collocated airborne radar measurements at 13.4 GHz,35.6 GHz and 94 GHz[
1 Basic theory
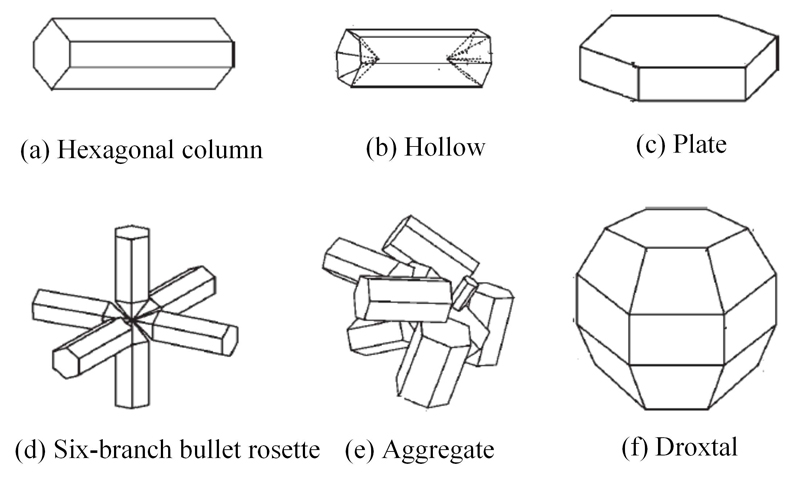
Cirrus clouds,which contain numerous ice crystals with different shapes,belong to the high-rise clouds. The thickness of cirrus clouds ranges from a few hundred meters to 5~7 kilometers,typically 1.5 to 2 kilometers. The horizontal extent ranges from a few kilometers to thousands of kilometers,covering an average of 20%~30% of Earth's sky,which results in a strong influence of the Earth's and atmospheric radiation,and further the weather and climate formation process. The ice cloud model is very complex. The scattering and attenuation characteristics are related to the complex shape and size of the particles and the incident wavelength. The maximum size of the non-spherical ice crystal particles can reach several millimeters. In the accurate radar inversion,it is not enough to treat the ice crystal grains as the Mie scattering ball or ellipsoid.
![]()
Figure 1.Ice crystals of different shapes
| Serial number | Ice crystals | Content(%) | Maximum dimensions(μm) |
|---|---|---|---|
| 1 | Droxtal | 100 | D<60 |
| 2 | Bullet rosette | 15 | 60<D<1 000 |
| Hexagonal column | 50 | ||
| Hexagonal plate | 35 | ||
| 3 | Hexagonal column | 45 | 1 000<D<2 500 |
| Solid hexagonal column | 45 | ||
| Aggregate | 10 | ||
| 4 | Bullet rosette | 97 | D>2 500 |
| Aggregate | 3 |
Table 1. New feature distribution of cirrus ice crystals
Simple shapes of ice crystals can be described by length L and maximum dimensions D. There is an empirical relationship between length L and half width a[
1)For a hexagonal column particle of width a,and length L,L=D,a=0.35L when L<100 μm;when L>100 μm,a=3.48L0.5.
2)For plate-shaped particles,L=2.4883a0.474,D=2a,when a≥5 μm.
3)The surface ratio of the bullet rosette particle is related to the length of each branch of the flower pattern. Generally,the particle length and the half-width have a statistical relationship a=1.552L0.63,D=2(L+t).
4)Aggregate particles are generally considered to be formed after the polymerization of bullet-type ice crystal grains. The statistical relationship between the half-width a and the particle length L is a=1.1552L0.63,D=7.297L,and the branch tip of the bullet type particle satisfies the width t=30.5/2tan(α),where α represents the inclination to the main axis.
5)Droxtal particles are generally regarded as spherical particles.
The measurement data of cirrus in China is relatively small. In contrast,the measurement of the physical characteristics of mid-latitude and tropical cirrus in foreign countries was carried out earlier,and the data is more comprehensive. At present,the typical measurement data includes FIRE-I,FIRE-II,ARM,TRMM,and CRYSTAL FACE. Field campaigns located in the mid-latitude include the First International Satellite Cloud Climatology Project Regional Experiments in Madison,Wisconsin,in 1986(FIRE-I)and Coffeyville,Kansas in 1991(FIRE-II). The distribution of particle size and crystal habit imagery from FIRE-II were obtained from balloon-borne replicators over a size range from about 10 to 500~1 000 meters. Another mid-latitude dataset was derived in the spring of 2 000 during an Atmospheric Radiation Measurement Program(ARM)intensive observation period near Lamont,Oklahom. In 1998 and 1999,four field campaigns were conducted under the auspices of the Tropical Rainfall Measuring Mission(TRMM). In addition,recent high-quality measurements have been acquired during the Cirrus Regional Study of Tropical Anvils and Cirrus Layers(CRYSTAL)Florida Area Cirrus Experiment(FACE)during a series of flights by the NASA WB57 aircraft and the UND Citation in 2002.
In 2005,after fitting the physical property data in the above five mid-latitude regions and the tropical cirrus database,Baum proposed a new feature distribution of cirrus ice crystals listed in
![]()
Figure 2.Comparison of the water content calculated by refined ice cloud model with real values[
![]()
Figure 3.The measured data of the latitudinal cirrus particle size distribution[
where D is the maximum dimensions of ice crystal grains,β is the slope,and μ is the divergence. The liquid ice water content(I)is related to the distribution function[
where ρ is ice density,fi(D)is the habit distribution,of ice crystals,
The relationship between ice water content I (g/m3)and Dm and ice crystal spectrum[
where N0,β,and μ are defined by
The radar reflectivity factor is a meteorological parameter related to the distribution of cloud particles. It is an intrinsic property of the cloud and does not change with detection methods[
where λ is the incident wavelength,and Ki equals to(m2-1)/(m2+1),where m is the complex refractive index of the ice crystal grains. Therefore,if we know the characteristics of the ice cloud(such as the distribution of the cloud droplet spectrum),we can theoretically calculate the radar reflectivity factor value.
The calculation of the backscattering cross-section of non-spherical ice crystals is based on the discrete dipole approximation(DDA)method[
2 Results and discussion
The shape and size of the ice crystal were considered in the backscattering section calculation process. The ice cloud model selected in this paper contains six ice crystal grains,and the backscattering sections of the hexagonal column and the hollow hexagonal column are basically the same. Based on the relationship between different ice crystallites L and a,the DDA algorithm was utilized to calculate the backscattering cross- section of six common non-spherical ice crystals shown in
The temperature was set to 253 K,the frequency was 220 GHz,and the complex refractive index of ice is 1.78+0.0039i. The variation on the backscattering cross section of the ice crystal with the maximum scale in the range of 50~5 000 μm is shown in
![]()
Figure 4.Variation of backscattering cross section of ice crystals with different shapes of the maximum dimension D
In the terahertz radar detection application,it is usually assumed that there is a relationship between the ice water content I and the radar reflectivity factor Zm
The value of N0 and β can be calculated according to the range of the median Dm and ice water content of ice crystals in the cloud. The range of Dm and I are 0.01≤Dm≤0.1 cm and 10-4≤I≤10-1(g/m3)respectively. In the above field,1 000 times(representing 1 000 kinds of ice crystal spectrum distribution were sampled according to the normal distribution Dm:n(0.05,0.0242)and I:n(0.05,0.0242)). Then Dm and I were substituted for
![]()
Figure 5.Zm-I relationship of (a) aggregate, (b) droxtal, (c) hexagonal column, (d) plate, (e) bullet rosette
In addition,combined with the ice cloud model provided by Baum et al.,the Zm-I relationship of different shapes of ice crystal particles was calculated. It can be seen from
![]()
Figure 6.Zm-I relationship of mixed ice crystal grains
Combined with the same ice cloud model and simulation method,the Zm-I relationship of different shapes of ice crystal particles was calculated at 94 GHz[
![]()
Figure 7.Comparison of the relationships between Zm and I derived in this study and other algorithms for ice clouds from previous studies at 94 GHz
The solid line in
![]()
Figure 8.Comparison of simulated data at 220 GH and measured data at 215 GHz
3 Conclusions
In this paper,the DDA method was applied to calculate the backscattering cross-section of a single ice crystal with different shapes. Then the Zm-I relation model of different non-spherical ice crystals was obtained by the refined feature distribution model. In this study,we find the Zm-I relationship is strongly sensitive to the microphysical properties of ice clouds,such as the ice crystal habits,mixtures of ice crystal habits,and particle size distributions. The results show the model with mixed ice crystal particles better fits with experimental data than the single spherical particle model. Later,the characteristic distribution of ice crystals of different heights will be considered to optimize the Zm-I relationship model.
References
[1] Ling-Zhi ZHONG, Li-Ping LIU, G E Runsheng. Characteristics about the millimeter-wavelength radar and its status and prospect in and abroad. Advances in Earth Science, 24, 383-391(2009).
[11] Xu TENG. Sensitivity of the W band airborne cloud radar reflectivity factor Z to cloud parameters(2011).

Set citation alerts for the article
Please enter your email address
© Copyright 2018-2021 | Chinese Laser Press. All Rights Reserved 沪ICP备15018463号-20