• Journal of Atmospheric and Environmental Optics
  • Vol. 18, Issue 3, 245 (2023)
CAO Yuan1、2, GONG Mingyan3, SHEN Fei1、2, MA Jinji1、2、*, YANG Guang1、2, and LIN Xiwen1、2
Author Affiliations
  • 1School of Geography and Tourism, Anhui Normal University, Wuhu 241002, China
  • 2Engineering Technology Research Center of Resources Environment and GIS, Anhui Province, Wuhu 241002, China
  • 3School of Physics and Electronic Information, Anhui Normal University, Wuhu 241002, China
  • show less
    DOI: 10.3969/j.issn.1673-6141.2023.03.006 Cite this Article
    Yuan CAO, Mingyan GONG, Fei SHEN, Jinji MA, Guang YANG, Xiwen LIN. Estimation of PM2.5 concentration and analysis of influencing factors in China[J]. Journal of Atmospheric and Environmental Optics, 2023, 18(3): 245 Copy Citation Text show less
    Random forest model inversion accuracy. (a) Train dataset; (b) test dataset
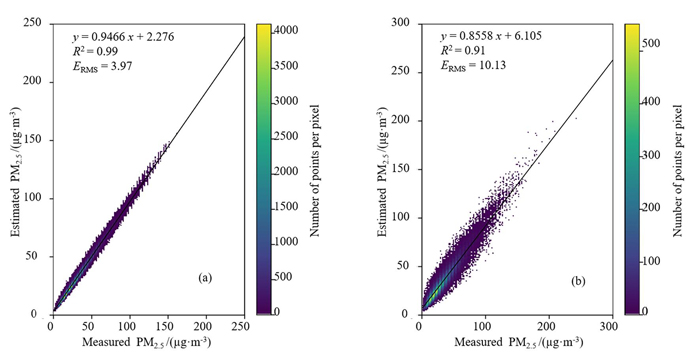
    Fig. 1. Random forest model inversion accuracy. (a) Train dataset; (b) test dataset
    Spatial distribution of original and estimated PM2.5 concentration on August 20, 2018. (a) Original value; (b) estimate value
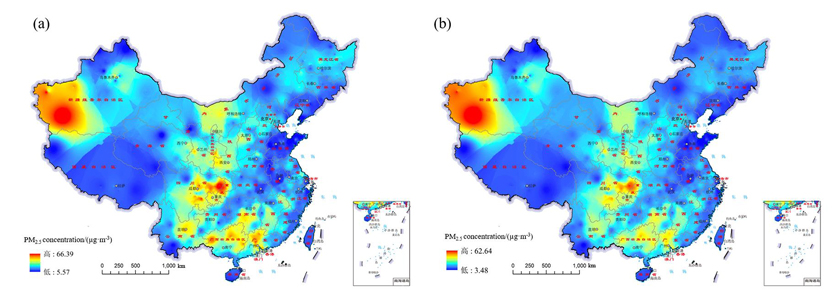
    Fig. 2. Spatial distribution of original and estimated PM2.5 concentration on August 20, 2018. (a) Original value; (b) estimate value
    Seasonal model inversion accuracy on test dataset. (a) Spring model; (b) summer model;(c) autumn model; (d) winter model
    Fig. 3. Seasonal model inversion accuracy on test dataset. (a) Spring model; (b) summer model;(c) autumn model; (d) winter model
    Area model inversion accuracy on test dataset. (a) Eastern model; (b) central model; (c) western model
    Fig. 4. Area model inversion accuracy on test dataset. (a) Eastern model; (b) central model; (c) western model
    Model feature importance ranking
    Fig. 5. Model feature importance ranking
    Three-dimensional spatial effect diagram of influence factors on changes of PM2.5 daily concentration. (a) AOD and BLH;(b) LAT and BLH; (c) BLH and TMP; (d) TMP and RH
    Fig. 6. Three-dimensional spatial effect diagram of influence factors on changes of PM2.5 daily concentration. (a) AOD and BLH;(b) LAT and BLH; (c) BLH and TMP; (d) TMP and RH
    Data typeData nameData codeUnitsData source
    Natural factors10m u-component of windUm·s-1

    ERA5 Dataset

    (https://climate.copernicus.eu)

    10m v-component of windVm·s-1
    2m temperatureTMPK
    Total precipitationPREm
    EvaporationEVAm
    Relative humidityRH%
    Boundary layer heightBLHm
    ElevationDEMm

    NASA SRTM Digital Elevation Dataset

    (https://cmr.earthdata.nasa.gov)

    AspectASPECT(°)
    Vegetation indexNDVI

    MOD13A2 v6 Dataset

    (https://lpdaac.usgs.gov)

    Human factorsPopulationPOP

    Landscan Dataset

    (https://landscan.ornl.gov/)

    Nighttime lightsNTLDN

    NPP VIIRS Dataset

    (https://eogdata.mines.edu/products/vnl/)

    Land useLUC

    MCD12Q1.006 Dataset

    (https://lpdaac.usgs.gov)

    Time and space factorsLongitudeLON(°)

    China Environmental Monitoring Station

    (http://www.cnemc.cn/)

    LatitudeLAT(°)
    Day of yearYODday
    Table 1. Information table of influencing factors
    ModelMain parameters
    n_estimatorsmax_depthmax_feature
    Spring model1193612
    Summer model1193712
    Autumn model1233613
    Winter model1243313
    Table 2. Seasonal model training parameter table
    ModelMain parameters
    n_estimatorsmax_depthmax_feature
    Eastern model1193612
    Central model1194012
    Western model1193012
    Table 3. Area model training parameter table
    KindModelTrain datasetTest dataset
    R2ERMS/(µg·m-3)R2ERMS/(µg·m-3)
    OverallChina model0.993.970.9110.13
    AreaEastern model0.993.480.919.41
    Central model0.993.540.939.07
    Western model0.984.850.8612.71
    SeasonSpring model0.984.560.8511.42
    Summer model0.972.570.787.15
    Autumn model0.993.160.918.29
    Winter model0.995.150.9113.67
    Table 4. Accuracy table of model inversion
    ModelTrain datasetTest dataset
    R2ERMS/(µg·m-3)R2ERMS/(µg·m-3)
    Multiple linear regression0.2429.730.2329.72
    Extreme gradient boosting0.7815.750.7516.47
    Random forest0.993.990.9110.13
    Table 5. Model precision comparison table
    Yuan CAO, Mingyan GONG, Fei SHEN, Jinji MA, Guang YANG, Xiwen LIN. Estimation of PM2.5 concentration and analysis of influencing factors in China[J]. Journal of Atmospheric and Environmental Optics, 2023, 18(3): 245
    Download Citation