
Han Zhang, Zhe Shao, Ke Zhao. Responsive mechanism and coordination mode effect of a bipyridine-based two-photon fluorescent probe for zinc ion[J]. Chinese Physics B, 2020, 29(8):
- Chinese Physics B
- Vol. 29, Issue 8, (2020)
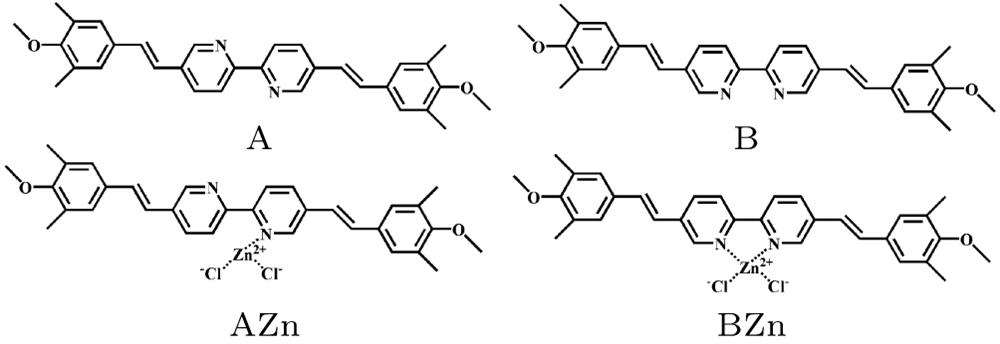
Fig. 1. Chemical structures of the molecules (A and B) and their corresponding zinc complexes.
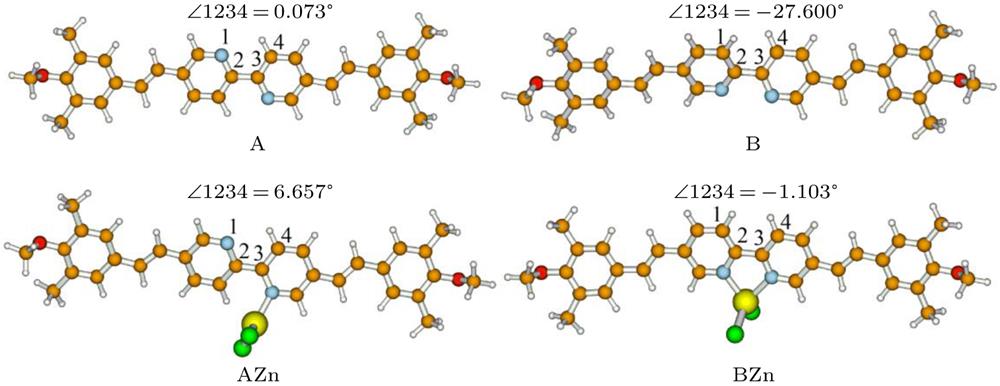
Fig. 2. Optimized geometries of the molecules (A and B) and their corresponding zinc complexes.
Fig. 3. Energy curves from the A to B (a) and from the AZn to BZn (b).
Fig. 4. Dihedral angle φ during 2–5 ns simulation.
Fig. 5. TPA spectra of molecules (A and B) and their corresponding zinc complexes.
Fig. 6. Divided parts of the molecules (A and B) and their corresponding zinc complexes.
Fig. 7. TPA spectra of molecule A and the structures with decreasing dihedral angle.
Fig. 8. Chemical structures and the corresponding optimized geometries of the zinc complexes AAZn, ABZn, and BBZn.
Fig. 9. TPA spectra of the zinc complexes AAZn, ABZn, and BBZn.
|
Table 1. One-photon absorption and emission properties of the molecules.
| |||||||||||||||||||||||||||||||||||||||||||||||||||||||||||||||||||||||
Table 2. Two-photon absorption wavelengths λtp and cross sections σ of the six lowest excited states of the molecules (A and B) and their corresponding zinc complexes.
|
Table 3. Net charges (in units of e) for divided parts of the molecules in the ground states and the first excited states.
| |||||||||||||||||||||||||||||||||||||||||||||||||||||||||||||||||||||||||||||||||||
Table 4. Two-photon absorption wavelengths λtp and cross sections σ of the ten lowest excited states of the zinc complexes AAZn, ABZn, and BBZn.

Set citation alerts for the article
Please enter your email address
© Copyright 2018-2021 | Chinese Laser Press. All Rights Reserved 沪ICP备15018463号-20