
Dashan Dong, Kebin Shi. Solving the missing cone problem by deep learning[J]. Advanced Photonics, 2020, 2(2): 020501
- Advanced Photonics
- Vol. 2, Issue 2, 020501 (2020)
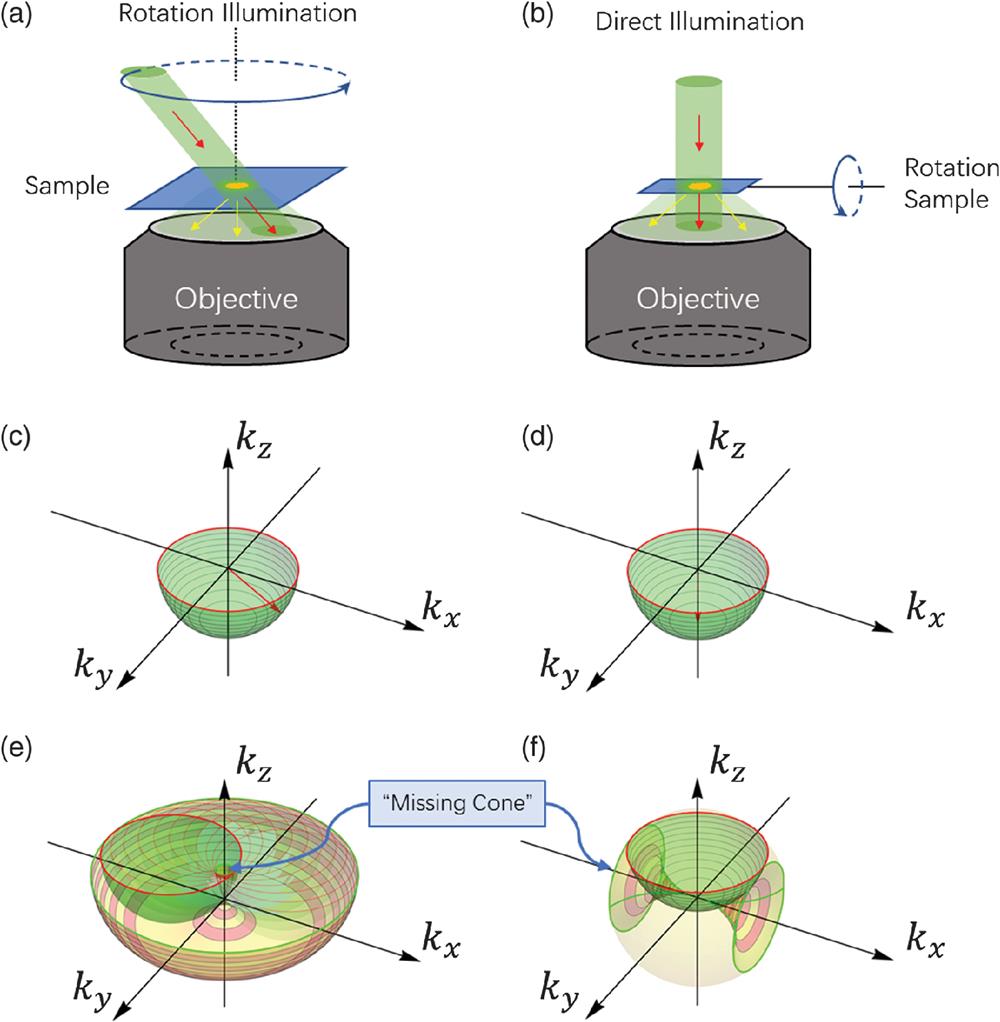
Fig. 1. Schematic diagram of “missing cone” in optical diffractive tomography (ODT). (a), (b) Schematic diagram of ODT with rotating illumination (a) and rotating sample (b). (c), (d) The spatial scattering spectrum captured by the objective: red arrows indicate the transmitted and scattered signal projected on a spherical cap; the numerical aperture of the objective limits the angular bandwidth of the scattered signal. (e), (f) ODT casts spatial spectrum caps from different rotation directions together in order to reconstruct the 3-D spatial spectrum of the sample. The missing spectrum along the rotation axis is observed with both illumination rotation (e) and sample rotation (f).

Set citation alerts for the article
Please enter your email address
© Copyright 2018-2021 | Chinese Laser Press. All Rights Reserved 沪ICP备15018463号-20