• Photonics Research
  • Vol. 10, Issue 9, 2040 (2022)
Ni Yao1、†, Xiaoyu Wang1、†, Shuqi Ma1、†, Xingda Song2, Shan Wang1, Zhangxing Shi3, Jing Pan2, Shipeng Wang1, Jianliang Xiao1, Haitao Liu1, Longteng Yu1, Yao Tang2, Zhang Zhang2, Xiong Li4, Wei Fang2、5、*, Lei Zhang1、2、6、*, and Limin Tong1
Author Affiliations
  • 1Research Center for Humanoid Sensing, Zhejiang Lab, Hangzhou 311121, China
  • 2State Key Laboratory of Modern Optical Instrumentation, College of Optical Science and Engineering, Zhejiang University, Hangzhou 310027, China
  • 3Shandong Institute of Advanced Technology, Jinan 250100, China
  • 4Tencent Robotics X Lab, Tencent Technology (Shenzhen) Co., Ltd, Shenzhen 518054, China
  • 5e-mail: wfang08@zju.edu.cn
  • 6e-mail: zhang_lei@zju.edu.cn
  • show less
    DOI: 10.1364/PRJ.461182 Cite this Article Set citation alerts
    Ni Yao, Xiaoyu Wang, Shuqi Ma, Xingda Song, Shan Wang, Zhangxing Shi, Jing Pan, Shipeng Wang, Jianliang Xiao, Haitao Liu, Longteng Yu, Yao Tang, Zhang Zhang, Xiong Li, Wei Fang, Lei Zhang, Limin Tong. Single optical microfiber enabled tactile sensor for simultaneous temperature and pressure measurement[J]. Photonics Research, 2022, 10(9): 2040 Copy Citation Text show less
    Single optical microfiber enabled tactile sensor for simultaneous temperature and pressure sensing. (a) Schematic of the human skin inspired microfiber sensor. Schematic illustration of the (b) temperature and (c) pressure sensing mechanism. (d) SEM image of a bent microfiber. (e) Photograph of a flexible bending sensor. (f) Photograph of a sensor attached to a glass vial.
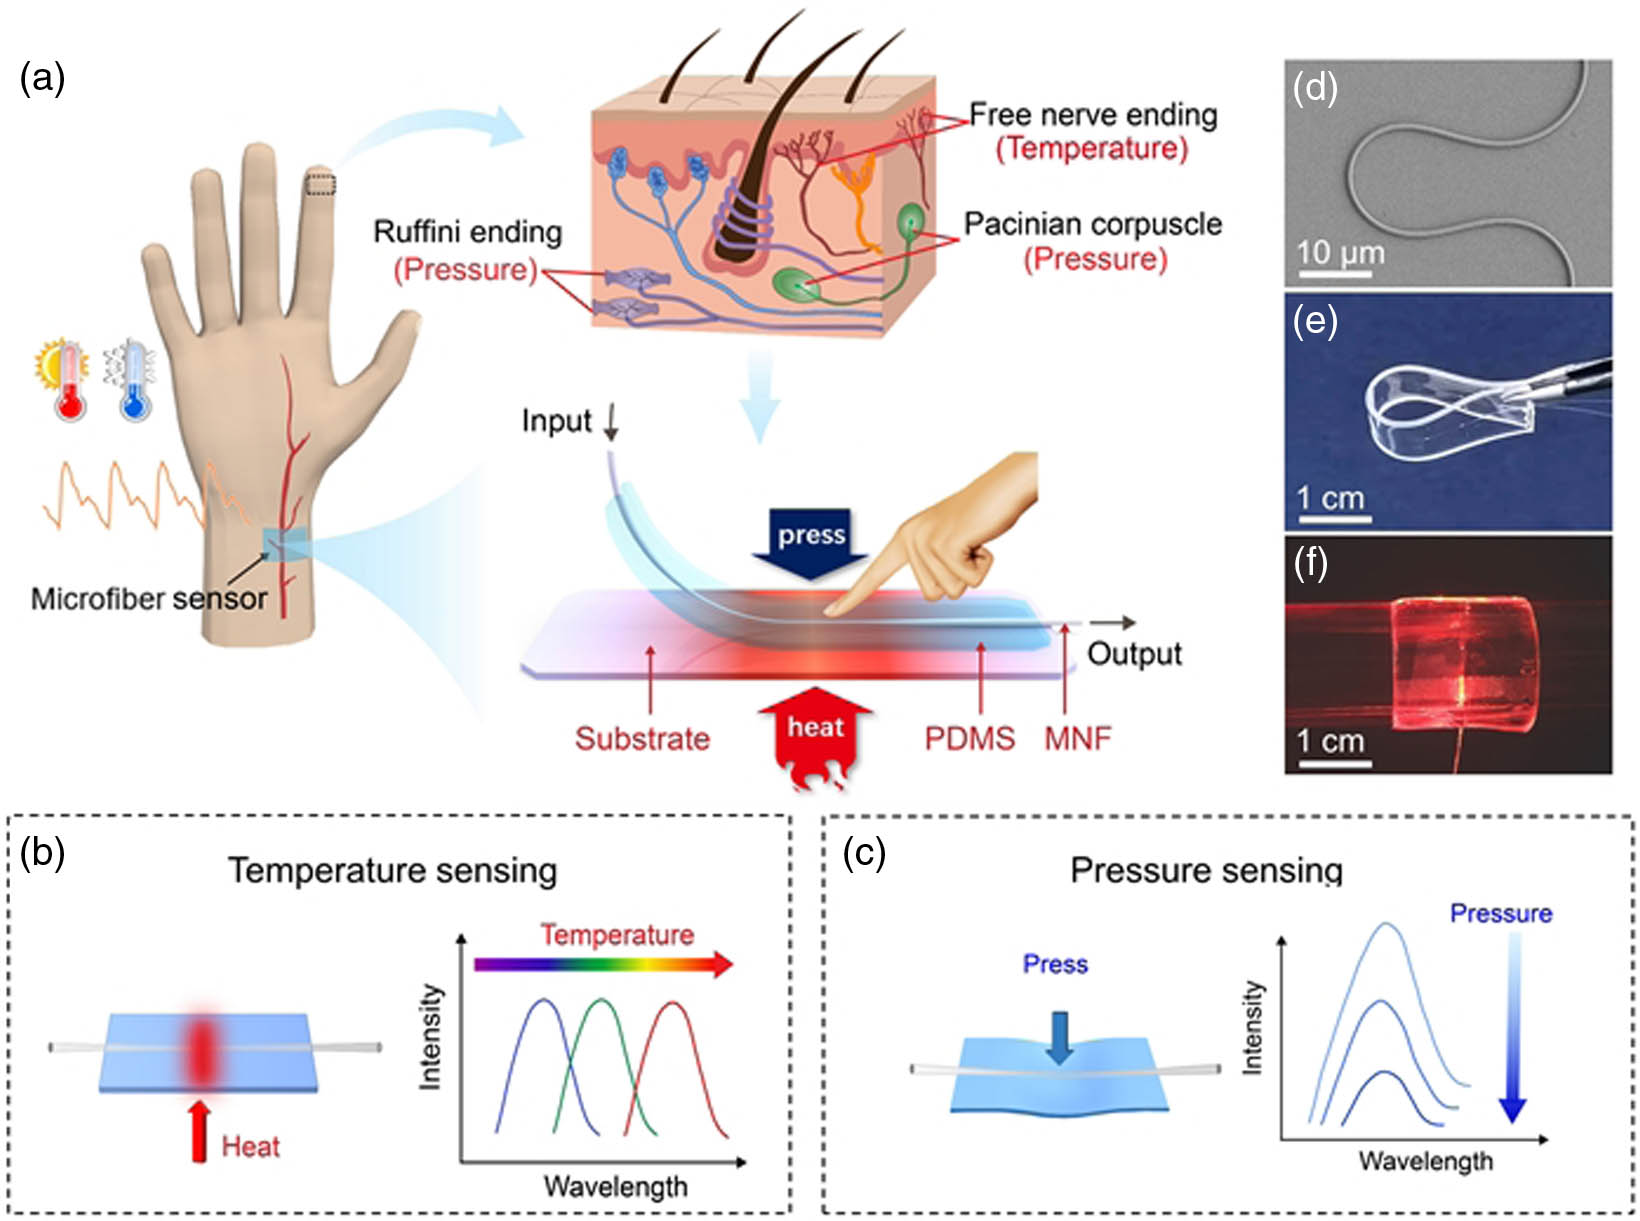
    Fig. 1. Single optical microfiber enabled tactile sensor for simultaneous temperature and pressure sensing. (a) Schematic of the human skin inspired microfiber sensor. Schematic illustration of the (b) temperature and (c) pressure sensing mechanism. (d) SEM image of a bent microfiber. (e) Photograph of a flexible bending sensor. (f) Photograph of a sensor attached to a glass vial.
    Temperature responses of the sensor. (a) The effective refractive indices of supported modes as functions of microfiber diameter at 532 nm wavelength. (b) Transmission spectra at different temperatures. The upper inset and the lower inset show the measured higher-order mode intensity profile and calculated EH21 mode intensity profile, respectively. (c) Peak wavelength of EH21 mode as a function of temperature. The red circles and black triangles represent the heating and cooling process, respectively. T, temperature. (d) Repeatability of the sensor is tested by alternately switching the temperature between 40°C and 80°C.
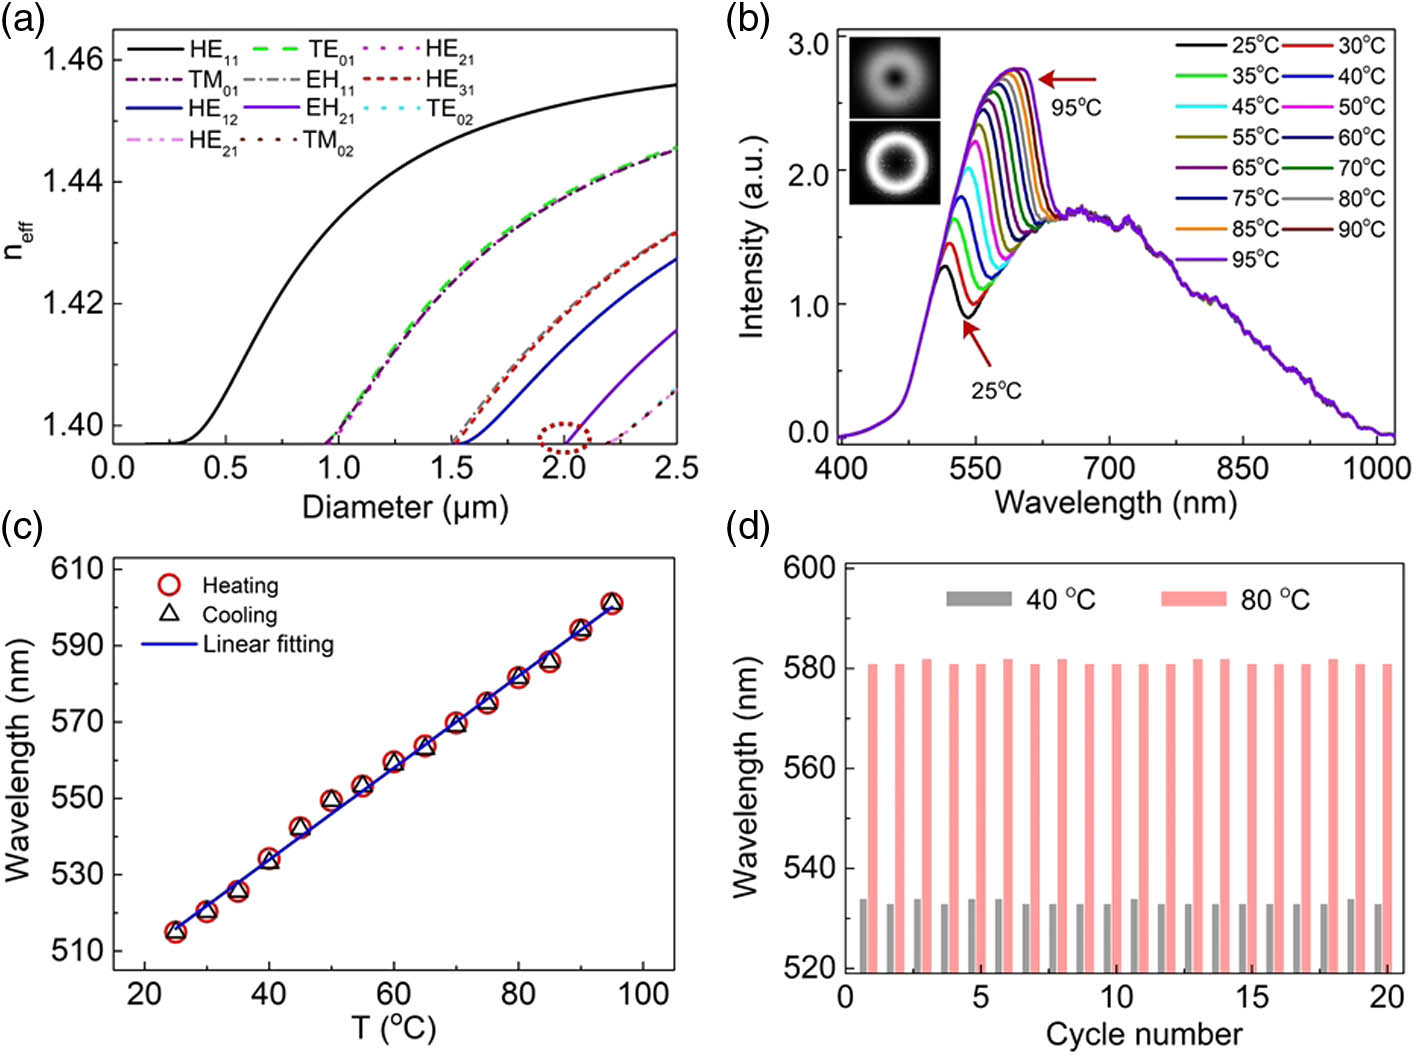
    Fig. 2. Temperature responses of the sensor. (a) The effective refractive indices of supported modes as functions of microfiber diameter at 532 nm wavelength. (b) Transmission spectra at different temperatures. The upper inset and the lower inset show the measured higher-order mode intensity profile and calculated EH21 mode intensity profile, respectively. (c) Peak wavelength of EH21 mode as a function of temperature. The red circles and black triangles represent the heating and cooling process, respectively. T, temperature. (d) Repeatability of the sensor is tested by alternately switching the temperature between 40°C and 80°C.
    Pressure responses of the sensor. (a) Transmission spectra under various pressures. (b) The peak wavelength corresponding to the cutoff of high-order EH21 mode under various pressures. The standard deviation of the wavelength distribution is 0.4 nm. (c) The normalized intensities at 700 nm, 800 nm, and 900 nm, respectively, as functions of pressures. (d) Repeatability of the sensor to static pressure. The sensor response to dynamic pressure at (e) 500 Hz and (f) 1000 Hz, respectively.
    Fig. 3. Pressure responses of the sensor. (a) Transmission spectra under various pressures. (b) The peak wavelength corresponding to the cutoff of high-order EH21 mode under various pressures. The standard deviation of the wavelength distribution is 0.4 nm. (c) The normalized intensities at 700 nm, 800 nm, and 900 nm, respectively, as functions of pressures. (d) Repeatability of the sensor to static pressure. The sensor response to dynamic pressure at (e) 500 Hz and (f) 1000 Hz, respectively.
    Simultaneous monitoring of temperature and the wrist pulse. (a) Photograph showing a single microfiber sensor for skin temperature and wrist pulse sensing, and the enlarged schematic diagram indicates the effect of temperature on the constriction and dilation of arterial vessels. (b) Wrist pulse waveform before and after exercise. (c) Typical wrist pulse waveform with measured distinguishable P-wave, T-wave, and D-wave peaks. (d) Typical spectral response of a microfiber sensor device directly above the artery of the wrist at room temperature, before and after exercise, and the infrared thermal image showing the temperature distribution of the wrist before and after exercise. (e) Comparison of the artery pulse pressure waveform variation with wrist temperature of 22.5°C and 40.0°C.
    Fig. 4. Simultaneous monitoring of temperature and the wrist pulse. (a) Photograph showing a single microfiber sensor for skin temperature and wrist pulse sensing, and the enlarged schematic diagram indicates the effect of temperature on the constriction and dilation of arterial vessels. (b) Wrist pulse waveform before and after exercise. (c) Typical wrist pulse waveform with measured distinguishable P-wave, T-wave, and D-wave peaks. (d) Typical spectral response of a microfiber sensor device directly above the artery of the wrist at room temperature, before and after exercise, and the infrared thermal image showing the temperature distribution of the wrist before and after exercise. (e) Comparison of the artery pulse pressure waveform variation with wrist temperature of 22.5°C and 40.0°C.
     Experimental SettingMeasurement ResultError
     T (°C)P (kPa)T (°C)P (kPa)TP
    1294.0428.84.120.67%1.94%
    23015.9630.116.100.33%0.87%
    34610.0645.810.240.44%0.90%
    4593.9458.54.040.85%1.50%
    56015.9060.316.040.50%0.88%
    Table 1. Comparison between Experimental Setting Values and Measurement Results
    Ni Yao, Xiaoyu Wang, Shuqi Ma, Xingda Song, Shan Wang, Zhangxing Shi, Jing Pan, Shipeng Wang, Jianliang Xiao, Haitao Liu, Longteng Yu, Yao Tang, Zhang Zhang, Xiong Li, Wei Fang, Lei Zhang, Limin Tong. Single optical microfiber enabled tactile sensor for simultaneous temperature and pressure measurement[J]. Photonics Research, 2022, 10(9): 2040
    Download Citation