
Xinyu Wang, Xuke Qiu, Mulong Liu, Feng Liu, Mengmeng Li, Linpei Xue, Bohan Chen, Mingran Zhang, Peng Xie. Flat soliton microcomb source[J]. Opto-Electronic Science, 2023, 2(12): 230024
- Opto-Electronic Science
- Vol. 2, Issue 12, 230024 (2023)
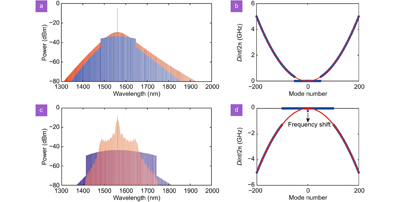
Fig. 1. Optical spectrums of single SMC source and dispersion curves. (a , c ) and (b , d ) are the simulated optical spectrums of single soliton and dispersion curves, respectively. Blue line and red line in dispersion curves correspond to the conditions of local flat integrated dispersion and initial dispersion. Large-scale flat dispersion reduces the microcomb power variations at the ultra-weak dispersion regime.
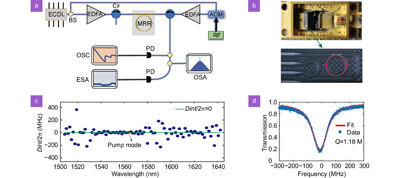
Fig. 2. Experimental setup. (a ) Experimental setup for the robust single SMC formation. An auxiliary laser is introduced for the stable soliton formation. ECDL, External cavity diode laser; EDFA, Erbium-doped fiber amplifier; OSA, Optical spectrum analyzer; OSC, Oscilloscope; ESA, Electrical spectrum analyzer; MRR, Micro-ring resonator; PD, Photodetector; Cir, Circulator. (b ) Microscope image of the high-index doped silica glass micro-ring resonator with a radius of 148.1 μm (lower panel). Butterfly-packaged device (upper panel). (c ) Dispersion characteristic of the MRR. The green line (Dint=0) is one referenced integrated dispersion curve. The micro-cavity demonstrates the ultra-flat dispersion characteristic. The red-dot is the soliton mode. (d ) The transmission spectra of the soliton mode.
Fig. 3. Experimental results at the flat dispersion regime. (a ) Power trace of microcomb evolution from the continuous wave (CW) state to single soliton state. MI: Modulation instability. I: Turning pattern. II: Dual-soliton microcomb. III: Single soliton microcomb. (b ) Radio frequency spectrum of single soliton state. (c ) Optical spectrums of Turning pattern (I), dual-soliton microcomb (II) and single SMC source (III). Via introducing the perfect rectangular spectrum as one standard reference, the single SMC demonstrates the trapezoidal spectrum with weak power-varied spectral profile. (d ) Long-term power trace of single SMC.
Fig. 4. Experimental results for SC formation with local relatively flat spectrum. (a ) Dispersion characteristic of microcavity. (b ) Soliton crystal with irregular inter-soliton spacings. Zoom-in local spectrum. At this frequency region, the microcomb demonstrates the relatively flat spectral profile. (c ) Temporal evolution of SC with local relatively flat spectral lines.

Set citation alerts for the article
Please enter your email address
© Copyright 2018-2021 | Chinese Laser Press. All Rights Reserved 沪ICP备15018463号-20