• Photonics Research
  • Vol. 12, Issue 3, 491 (2024)
Jun Li1、2、3、*, Yaping Yang1、4、*, and C.-M. Hu2、5、*
Author Affiliations
  • 1MOE Key Laboratory of Advanced Micro-Structured Materials, School of Physics Science and Engineering, Tongji University, Shanghai 200092, China
  • 2Department of Physics and Astronomy, University of Manitoba, Winnipeg, Manitoba R3T 2N2, Canada
  • 3e-mail: jli_phys@tongji.edu.cn
  • 4e-mail: yang_yaping@tongji.edu.cn
  • 5e-mail: hu@physics.umanitoba.ca
  • show less
    DOI: 10.1364/PRJ.509746 Cite this Article Set citation alerts
    Jun Li, Yaping Yang, C.-M. Hu. Multichannel coupling induced topological insulating phases with full multimerization[J]. Photonics Research, 2024, 12(3): 491 Copy Citation Text show less
    Theoretical tight-binding hopping model. (a) Schematic of n(n=3, 4, 5…) resonators coupled with each other with uniform hopping amplitude κ. (b)–(d) Bulk model with n sites per unit cell, with uniform hoppings, unit cells framed in red dashed box.
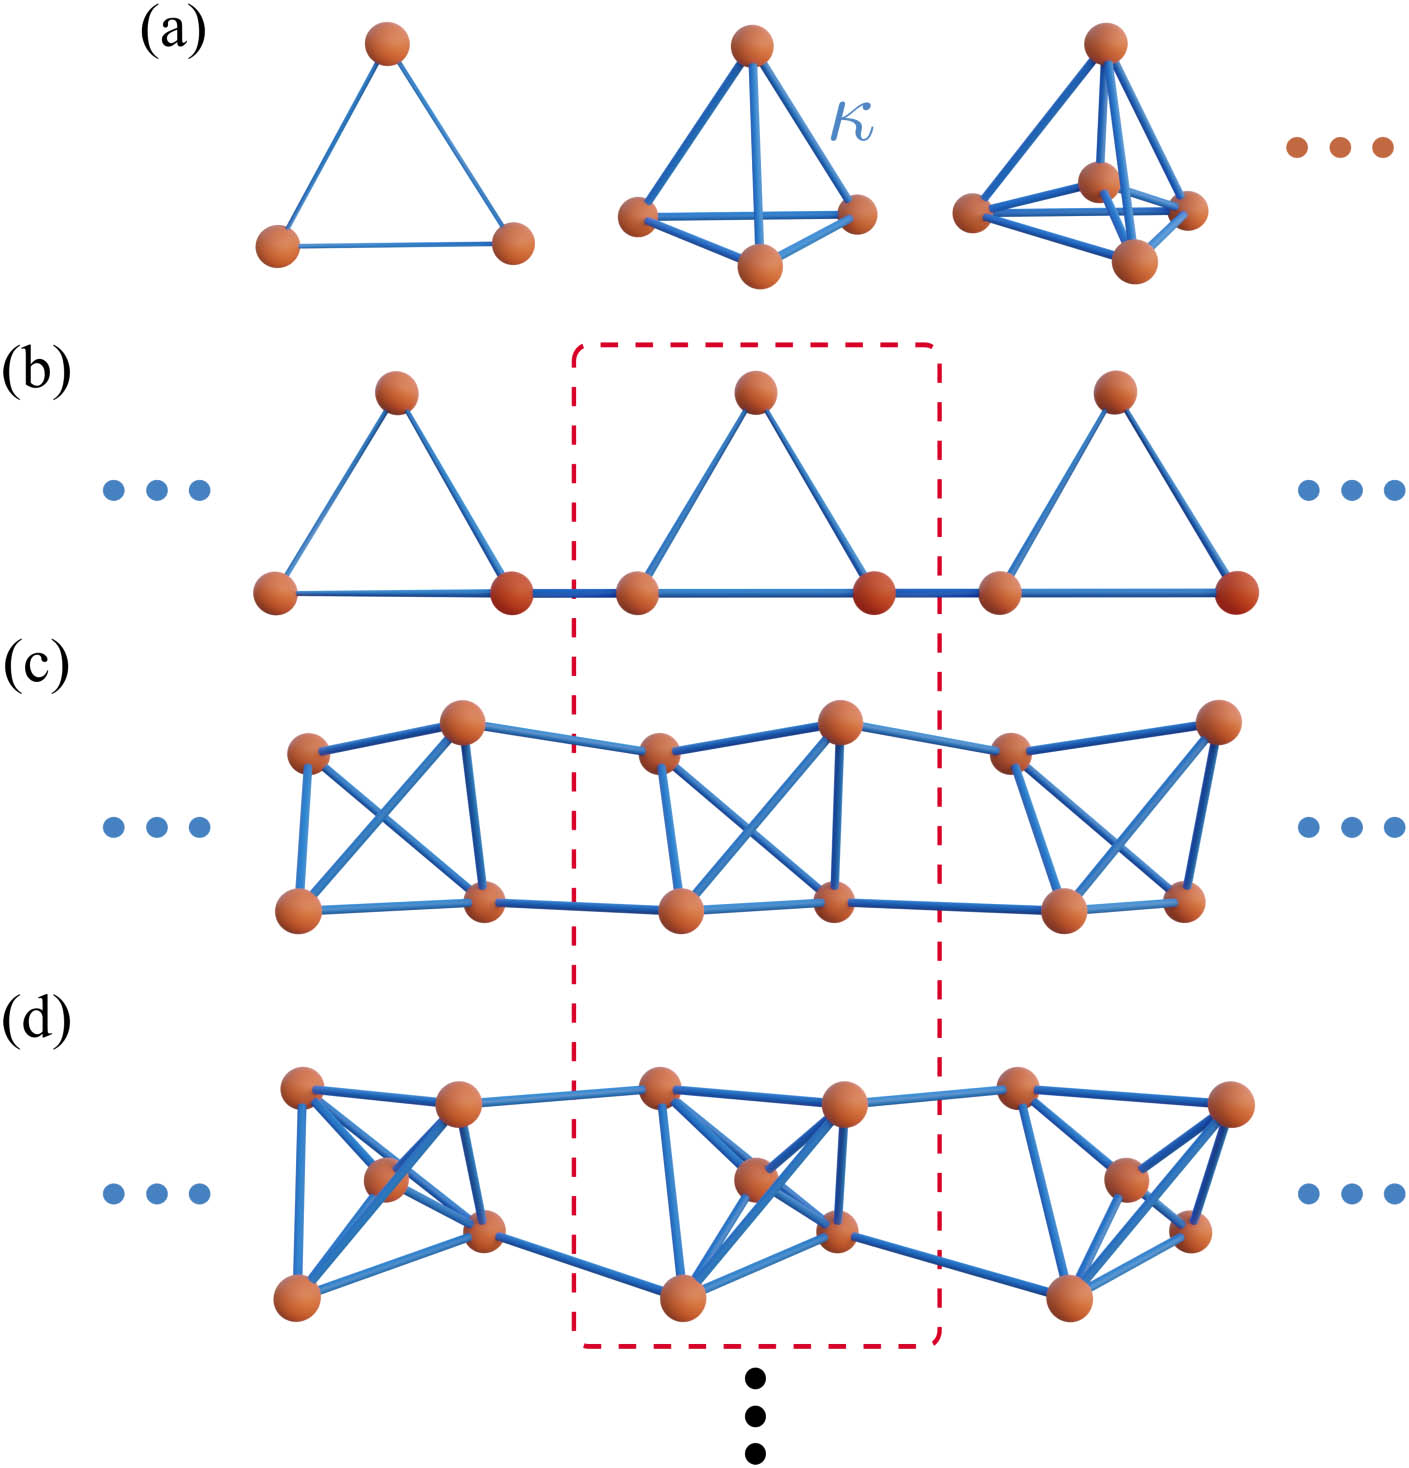
    Fig. 1. Theoretical tight-binding hopping model. (a) Schematic of n(n=3,  4,  5) resonators coupled with each other with uniform hopping amplitude κ. (b)–(d) Bulk model with n sites per unit cell, with uniform hoppings, unit cells framed in red dashed box.
    Topological edge states of multimer chains. (a)–(c) Normalized band structures with quantized Zak phases and (d)–(f) sorted eigenvalues of topological finite chains (composed of 60 resonators) with (g)–(i) corresponding representative wavefunctions for (a), (d), (g) n=3; (b), (e), (h) n=4; and (c), (f), (i) n=5, respectively. Zak phases for the bands labeled by red are −π and 0 by blue in (a)–(c). The edge and bulk states in (d)–(f) with the corresponding intensity distributions in (g)–(i) are represented by color and gray, respectively. Particularly, the wavefunction distributions in panels (h) and (i) represent individual instances of potential numerical solutions for n=4 and n=5, respectively.
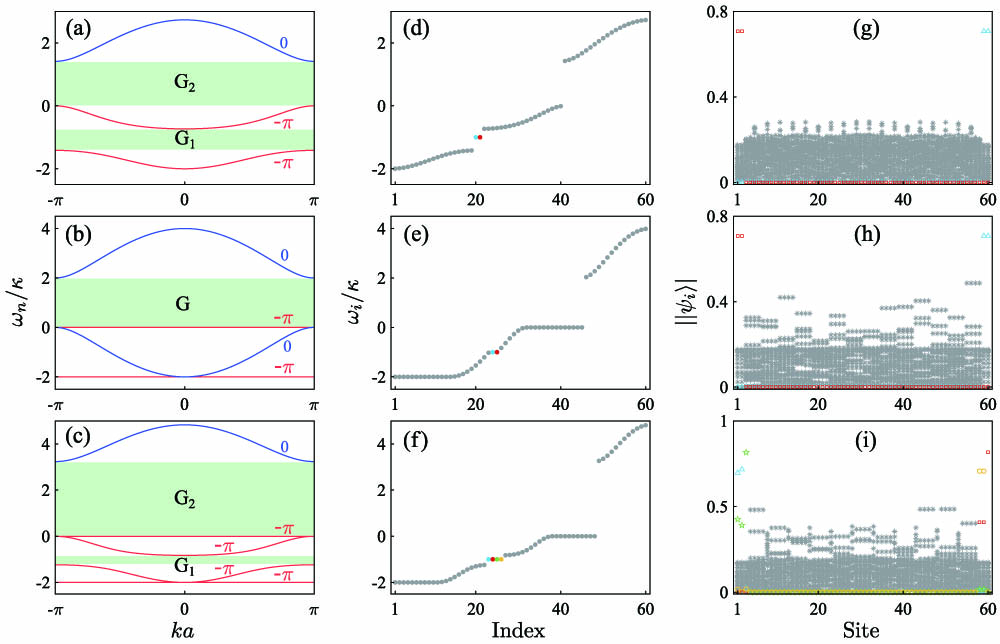
    Fig. 2. Topological edge states of multimer chains. (a)–(c) Normalized band structures with quantized Zak phases and (d)–(f) sorted eigenvalues of topological finite chains (composed of 60 resonators) with (g)–(i) corresponding representative wavefunctions for (a), (d), (g) n=3; (b), (e), (h) n=4; and (c), (f), (i) n=5, respectively. Zak phases for the bands labeled by red are π and 0 by blue in (a)–(c). The edge and bulk states in (d)–(f) with the corresponding intensity distributions in (g)–(i) are represented by color and gray, respectively. Particularly, the wavefunction distributions in panels (h) and (i) represent individual instances of potential numerical solutions for n=4 and n=5, respectively.
    Observation of topological edge states in trimer chain. (a) Circuit diagram of the finite experimental trimer chain; unit cells consist of three capacitors C with identical inductors L between every two capacitors framed in gray dashed boxes. The lattice nodes are marked by the green dots. (b) Calculated admittance eigenspectrum of the LC circuit for C=1 nF and L=1.1 μH. (c) Measured impedances between the nodes (|Z1|, |Z13|, and |Z17|) and ground versus the frequency of the circuit. (d) Location distribution of impedance at the frequency f=9.57 MHz.
    Fig. 3. Observation of topological edge states in trimer chain. (a) Circuit diagram of the finite experimental trimer chain; unit cells consist of three capacitors C with identical inductors L between every two capacitors framed in gray dashed boxes. The lattice nodes are marked by the green dots. (b) Calculated admittance eigenspectrum of the LC circuit for C=1  nF and L=1.1  μH. (c) Measured impedances between the nodes (|Z1|, |Z13|, and |Z17|) and ground versus the frequency of the circuit. (d) Location distribution of impedance at the frequency f=9.57  MHz.
    Observation of topological BICs in tetramer chain. (a) Circuit diagram blueprint with unit cells framed in gray dashed boxes and nodes marked by green dots. (b) Calculated admittance eigenvalues of the tetramer LC circuit for C=1 nF and L=1.1 μH. (c) Frequency scan of measured impedances for representative edge (|Z1|) and bulk (|Z13| and |Z17|) nodes. (d) Impedance distribution of topological edge mode at the frequency f=10.52 MHz.
    Fig. 4. Observation of topological BICs in tetramer chain. (a) Circuit diagram blueprint with unit cells framed in gray dashed boxes and nodes marked by green dots. (b) Calculated admittance eigenvalues of the tetramer LC circuit for C=1  nF and L=1.1  μH. (c) Frequency scan of measured impedances for representative edge (|Z1|) and bulk (|Z13| and |Z17|) nodes. (d) Impedance distribution of topological edge mode at the frequency f=10.52  MHz.
    Photograph of circuit boards realization for (a) trimer chain and (b) tetramer chain. Unit cells of the boards are framed in the dashed boxes. The single pin header connectors at wire junctions are the nodes of circuits. The nodes are labeled by site 1 to 24 from left to right as circled. Inductors L between the nodes realize the hoppings and inductors to ground are to ensure a uniform frequency. Capacitors C connect each node to ground.
    Fig. 5. Photograph of circuit boards realization for (a) trimer chain and (b) tetramer chain. Unit cells of the boards are framed in the dashed boxes. The single pin header connectors at wire junctions are the nodes of circuits. The nodes are labeled by site 1 to 24 from left to right as circled. Inductors L between the nodes realize the hoppings and inductors to ground are to ensure a uniform frequency. Capacitors C connect each node to ground.
    Schematic diagram of the experimental measurement setup where the green dots indicate wiring for measuring.
    Fig. 6. Schematic diagram of the experimental measurement setup where the green dots indicate wiring for measuring.
    Jun Li, Yaping Yang, C.-M. Hu. Multichannel coupling induced topological insulating phases with full multimerization[J]. Photonics Research, 2024, 12(3): 491
    Download Citation