• Journal of Resources and Ecology
  • Vol. 11, Issue 5, 435 (2020)
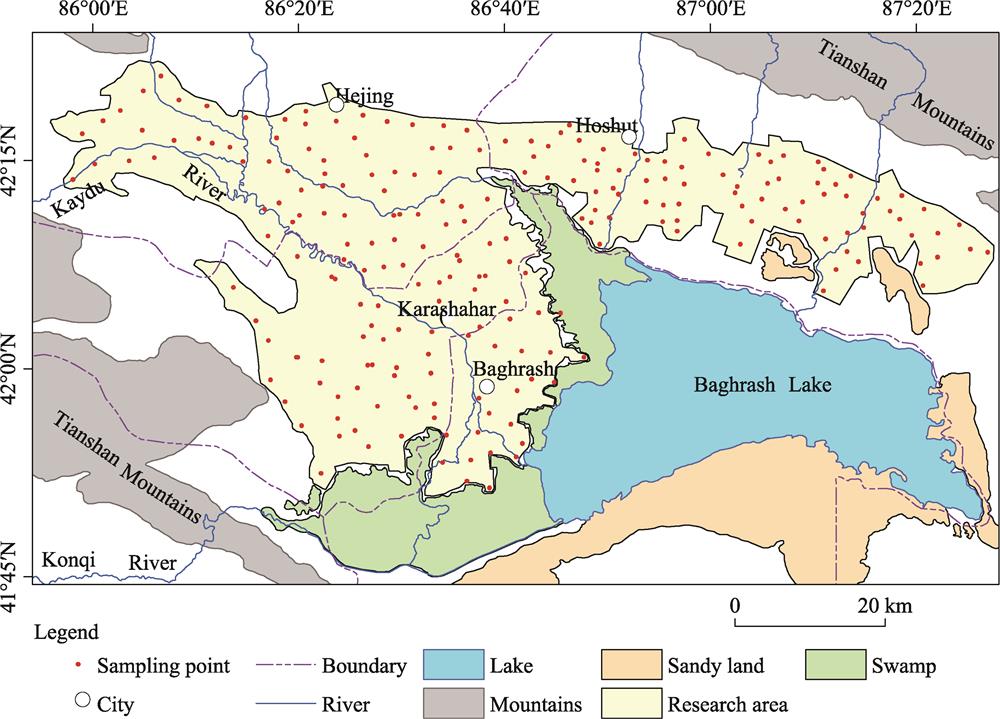
EZIZ Mamattursun1、1、2、2、*, HAYRAT Adila1、1, and Xiuyun YANG1、1
Author Affiliations
  • 1College of Geographical Science and Tourism, Xinjiang Normal University, Urumqi 830054, China
  • 1新疆师范大学地理科学与旅游学院,乌鲁木齐 830054
  • 2Laboratory of Arid Zone Lake Environment and Resources, Xinjiang Normal University, Urumqi 830054, China
  • 2新疆师范大学新疆干旱区湖泊环境与资源实验室,乌鲁木齐 830054
  • show less
    DOI: 10.5814/j.issn.1674-764x.2020.05.001 Cite this Article
    EZIZ Mamattursun, HAYRAT Adila, Xiuyun YANG. Comparison and Analysis of Estimation Methods for Heavy Metal Pollution of Farmland Soils[J]. Journal of Resources and Ecology, 2020, 11(5): 435 Copy Citation Text show less
    Fig. 1
    Fig. 1. Fig. 1
    IndexCalculating formulaCharacteristics of parameters
    PiPi = Ci /BiWhere Ci represents the concentration of element i in the soil sample, and Bi represents the background value of element i
    IgeoIgeo = log2(Ci /1.5Bi)Where Ci and Bi are the same as above, and 1.5 represents a background matrix correction factor that includes possible variations of the background values due to lithogenic effects
    EFEF = (Ci /Cr) /(Bi /Br)Where Ci and Bi are the same as above, Cr is the concentration of the reference metal, and Br is the background value of the reference elements
    ERER = (Ci /Si) × TiWhere Ci is the same as above, Si is the limit-risk concentration of element i, and Ti is the toxic response factor of element i in the soil sample
    IerIer = (Ci /Si) - 1Where Ci and Si are the same as above
    Table 1.

    The calculating formulas for the Pi, Igeo, EF, ER, and Ier Index

    ClassPiPollution degreeIgeoPollution degreeEFPollution degreeERRisk degreeIerRisk degree
    ≤0.7Unpolluted≤0Unpolluted≤2Unpolluted≤40Low risk≤0Low risk
    0.7-1Low0-1Unpolluted to moderately2-5Low40-80Moderate risk0-1Moderate risk
    1-2Moderately1-2Moderately5-20Moderately80-160Considerable risk1-3Considerable risk
    2-3High2-3Moderately to strongly20-40High160-320High risk3-5High risk
    > 3Extremely3-4Strongly> 40Extremely> 320Extremely high risk> 5Extremely high risk
    --4-5Strongly to extremely------
    --> 5Extremely------
    Table 2.

    Classification of pollution degrees using Pi, Igeo, EF, ER, and Ier

    ItemsAsCdCrCuMnNiPbZn
    Minimum (mg kg-1)0.520.0533.6819.45312.8219.450.9938.99
    Maximum (mg kg-1)28.870.38123.3973.12789.6855.9796.36434.88
    Median (mg kg-1)4.780.2153.8030.08501.7233.9637.4573.72
    Average (mg kg-1)6.500.2055.7330.52503.2834.2141.1689.31
    Standard deviation (mg kg-1)4.220.0611.636.2261.766.7724.1657.80
    CV0.650.300.210.200.120.200.590.65
    Background value (mg kg-1)11.200.1239.6035.80688.0026.4013.5016.80
    National Standard (GB 15618-2018) (mg kg-1)25.000.60250.00100.00-190.00170.00300.00
    Table 3.

    Descriptive statistics of heavy metal concentrations in agricultural soil samples (n=186)

    Assessment methodStatisticsAsCdCrCuNiPbZn
    PiMinimum0.050.420.850.540.740.072.32
    Maximum2.583.173.122.042.127.1425.89
    Average0.541.671.410.851.303.055.32
    IgeoMinimum-5.00-1.85-0.82-1.47-1.03-4.350.63
    Maximum0.781.081.050.450.502.254.11
    Average-1.760.07-0.12-0.84-0.240.641.67
    EFMinimum0.070.640.960.731.000.103.81
    Maximum4.164.193.803.103.2511.5330.75
    Average0.742.301.931.171.784.217.27
    ERMinimum0.212.500.270.970.510.030.13
    Maximum11.5519.00.993.661.472.831.45
    Average2.4210.040.451.530.901.210.30
    IerMinimum-0.98-0.92-0.87-0.81-0.90-0.99-0.87
    Maximum0.15-0.37-0.51-0.27-0.71-0.430.45
    Average-0.76-0.67-0.78-0.69-0.82-0.76-0.70
    Table 4.

    Statistics of Pi, Igeo, EF, ER, and Ier values of heavy metals in farmland soils in the study area

    Assessing methodAsCdCrCuNiPbZn
    Pi
    Igeo
    EF
    ER
    Ier
    Table 5.

    Pollution grades of each element with different assessment methods

    Assessing methodOrder
    PiZn > Pb > Cd > Cr > Ni > Cu > As
    IgeoZn > Pb > Cd > Cr > Ni > Cu > As
    EFZn > Pb > Cd > Cr > Ni > Cu > As
    ERCd > As > Cu > Pb > Ni > Cr > Zn
    IerCd > Cu > Zn > As = Pb > Cr > Ni
    Table 6.

    Decreasing order of heavy metal pollution

    EZIZ Mamattursun, HAYRAT Adila, Xiuyun YANG. Comparison and Analysis of Estimation Methods for Heavy Metal Pollution of Farmland Soils[J]. Journal of Resources and Ecology, 2020, 11(5): 435
    Download Citation