• Chinese Journal of Lasers
  • Vol. 48, Issue 20, 2010001 (2021)
Qiang Zhao1、2、*, Hongchao Su1、**, Mingjian Yi1, Dongsheng Yu3, and Chidong Xu3
Author Affiliations
  • 1School of Environment and Energy Engineering, Anhui Jianzhu University, Hefei, Anhui 230601, China
  • 2Anhui Institute of Strategic Study on Carbon Dioxide Emissions Peak and Carbon Neutrality in Urban-Rural Development, Hefei, Anhui 230601, China
  • 3Anhui Institute of Optics and Fine Mechanics, Chinese Academy of Sciences, Hefei, Anhui 230031, China
  • show less
    DOI: 10.3788/CJL202148.2010001 Cite this Article Set citation alerts
    Qiang Zhao, Hongchao Su, Mingjian Yi, Dongsheng Yu, Chidong Xu. Aerosol Horizontal Distribution Detected by Lidar in Excavation Stage of Construction Site Foundation Pit[J]. Chinese Journal of Lasers, 2021, 48(20): 2010001 Copy Citation Text show less
    LVIS-T100 portable lidar. (a) Overall appearance; (b) radar system structure
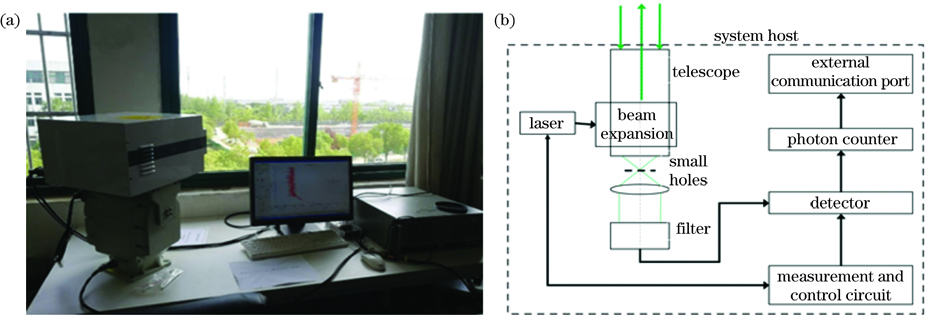
    Fig. 1. LVIS-T100 portable lidar. (a) Overall appearance; (b) radar system structure
    Lidar observation of construction site. (a) Location map; (b) site map of foundation pit excavation
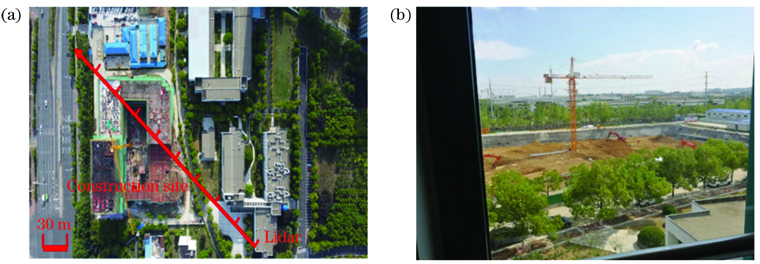
    Fig. 2. Lidar observation of construction site. (a) Location map; (b) site map of foundation pit excavation
    Geometric factor correction of lidar. (a) Geometric factor; (b) change number of echo photons before and after geometric factor correction
    Fig. 3. Geometric factor correction of lidar. (a) Geometric factor; (b) change number of echo photons before and after geometric factor correction
    Horizontal extinction coefficient profiles at four moments on August 24, 2019
    Fig. 4. Horizontal extinction coefficient profiles at four moments on August 24, 2019
    Correlation between extinction coefficient and PM10 mass concentration
    Fig. 5. Correlation between extinction coefficient and PM10 mass concentration
    Histogram of the hourly mean value of PM10 mass concentration
    Fig. 6. Histogram of the hourly mean value of PM10 mass concentration
    Horizontal distribution profiles of PM10 mass concentration at 9 o'clock every day from October 19 to 22
    Fig. 7. Horizontal distribution profiles of PM10 mass concentration at 9 o'clock every day from October 19 to 22
    Change of PM10 mass concentration at different distances on October 22, 2019
    Fig. 8. Change of PM10 mass concentration at different distances on October 22, 2019
    Contour map of PM10 mass concentration change
    Fig. 9. Contour map of PM10 mass concentration change
    Profile of the contour line of PM10 mass concentration change
    Fig. 10. Profile of the contour line of PM10 mass concentration change
    ParameterContent
    Laser wavelength/nm532 (LD pumped Nd∶YAG)
    Energy/μJ~20@2500 Hz
    Laser pulse width/ns≤15
    Receiving telescopeCaliber Φ100 mm
    Filter bandwidth/nm0.5
    Number of acquisitionchannels1 piece
    Data collectorMulti-channel photoncounter
    Table 1. Lidar parameters
    DateInversion mean valueMeasured valueRelative error
    October 19117.2658132.4139-11.44%
    October 20115.674499.146716.67%
    October 21135.1572122.780910.08%
    October 22128.6338147.6513-12.88%
    Table 2. Comparison of the relative error between the inversion hourly mean value and the measured value of PM10 mass concentration at 0.21 km
    Qiang Zhao, Hongchao Su, Mingjian Yi, Dongsheng Yu, Chidong Xu. Aerosol Horizontal Distribution Detected by Lidar in Excavation Stage of Construction Site Foundation Pit[J]. Chinese Journal of Lasers, 2021, 48(20): 2010001
    Download Citation