
Jun-Liang Yang, Zhong-Liang Li, Tang Li, Ye Zhu, Li Song, Lian Xue, Xiao-Wei Zhang. Characteristics of multi-crystals monfiguration X-ray diffraction and application in characterizing synchrotron beamline bandwidth [J]. Acta Physica Sinica, 2020, 69(10): 104101-1
- Acta Physica Sinica
- Vol. 69, Issue 10, 104101-1 (2020)
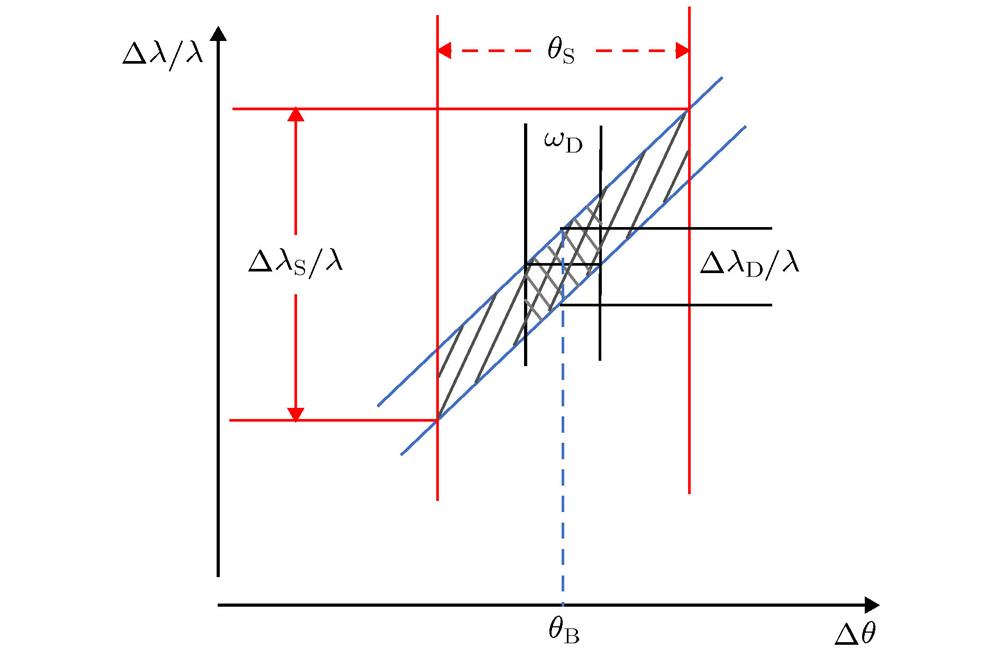
Fig. 1. DuMond diagram for the symmetric Bragg geometry. The differential equation (2) of diffraction formula corresponds to the line band with a slope of
 .
.
 and
and
 represent the kinematic diffraction angle and the Darwin width of the dynamic diffraction, respectively. In this article, we ignore the change of X-ray diffraction angle position which is influenced by crystal refraction. When the incident white beam is completely parallel, both the receiving and emitting angle of the symmetric crystal are the same, which can be represented by
 . The limited angle broadband introduces the corresponding wavelength distribution
 . When the incident beam with a divergence angle, the distribution of the incident angle on the crystal becomes larger which affects the angular divergence of bandwidth changing from
 to
to
 (the divergence angle of the beam) and the wavelength distribution changing to

.
and
represent the kinematic diffraction angle and the Darwin width of the dynamic diffraction, respectively. In this article, we ignore the change of X-ray diffraction angle position which is influenced by crystal refraction. When the incident white beam is completely parallel, both the receiving and emitting angle of the symmetric crystal are the same, which can be represented by
. The limited angle broadband introduces the corresponding wavelength distribution
. When the incident beam with a divergence angle, the distribution of the incident angle on the crystal becomes larger which affects the angular divergence of bandwidth changing from
to
(the divergence angle of the beam) and the wavelength distribution changing to
![The experimental configuration of (+1, –1) type non-dispersive consists of the second crystal of Si111-DCM and Si111 analyzer. The[111] is the crystal direction of the normal of the diffraction plane.](/richHtml/wlxb/2020/69/10/20200165/img_2.jpg)
Fig. 2. The experimental configuration of (+1, –1) type non-dispersive consists of the second crystal of Si111-DCM and Si111 analyzer. The[111] is the crystal direction of the normal of the diffraction plane.
Fig. 3. The experimental configuration of (+1, +1) type dispersive consists of the second crystal of Si111-DCM and Si111 analyzer.
Fig. 4. DuMond diagrams during scanning the output beam of DCM by analyzer. Panel (a) represents the non-dispersive (+1, –1) configuration and panel (b) represents the dispersive (+1, +1) configuration. The oblique line region is the DuMond window of the DCM. The point region is the DuMond window of the analyzer.
Fig. 5. The experimental configuration of (+1, –3) type dispersive consists of the second crystal of Si111-DCM and Si333 analyzer.
Fig. 6. The experimental configuration of (+1, +3) type dispersive consists of the second crystal of Si111-DCM and Si333 analyzer.
Fig. 7. DuMond diagrams during scanning the output beam of DCM by Si(333) analyzer. Panel (a) and (b) represent the (+1, –3) typeand (+1, +3) type dispersive configuration, respectively. The green dotted arrow indicates the scanning process. The two point-regions give the starting and ending position of the DuMond window of the analyzer.
Fig. 8. (a) and (b) give the rocking curves of the Si (111) analyzer with different slit vertical widths under the conditions of non-dispersion configuration and “fixed dispersion” configuration, respectively. (c) gives the FWHM curve of the rocking curve when the slit vertical width is adjusted under the condition of non-dispersion configuration and “fixed dispersion” configuration.
Fig. 9. (a) and (b) show the results of slit width difference of rocking curve with (+1, –1) and (+1, +1) experimental configurations with Si111 analyzer, respectively. The coordinate origin of the transverse axis corresponds to the diffraction angle of the analytic crystal at 10 keV. Also, (b) is the DuMond diagram without slit (angle) - wavelength conversion obtained using Si111 analyzer under the condition of dispersion configuration. The measured values of rocking curve FWHM with different slit widths can be read directly from the figure.
Fig. 10. (a) and (b) give the pseudo DuMond diagram using Si333 analyzer under the condition of (+1, –3) type and (+1, +3) type dispersion configuration, respectively.
|
Table 1. The experimental values obtained from different experimental configurations and the values after deconvolution of the analyzer and removal of dispersion broadening. Unit: arcsec.

Set citation alerts for the article
Please enter your email address
© Copyright 2018-2021 | Chinese Laser Press. All Rights Reserved 沪ICP备15018463号-20