
Haijun DENG, Bin GUO, Yongqiang CAO, Zhongsheng CHEN, Yuqing ZHANG, Xingwei CHEN, Lu GAO, Ying CHEN, Meibing LIU. Spatial and temporal patterns of daytime and nighttime precipitation in China during 1961-2016 [J]. Geographical Research, 2020, 39(10): 2415
- Geographical Research
- Vol. 39, Issue 10, 2415 (2020)
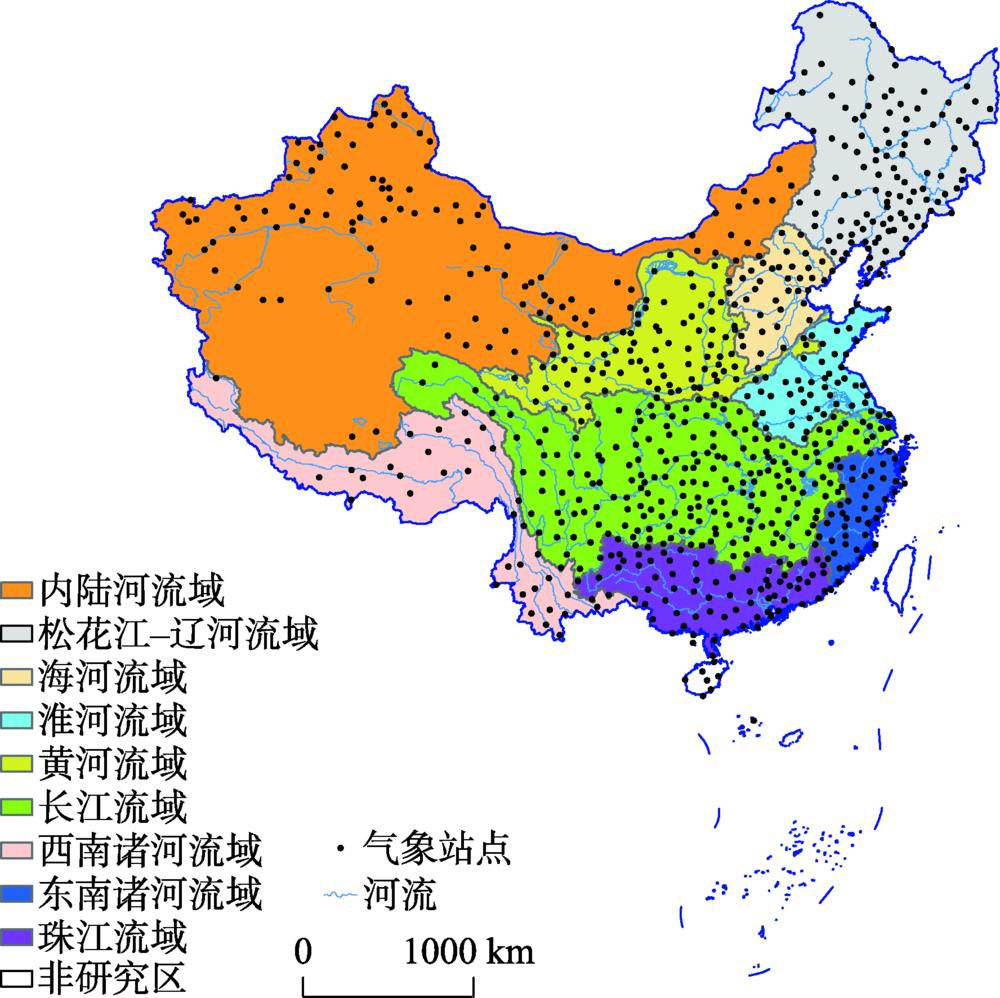
Fig. 1. Study area and meteorological stations of China
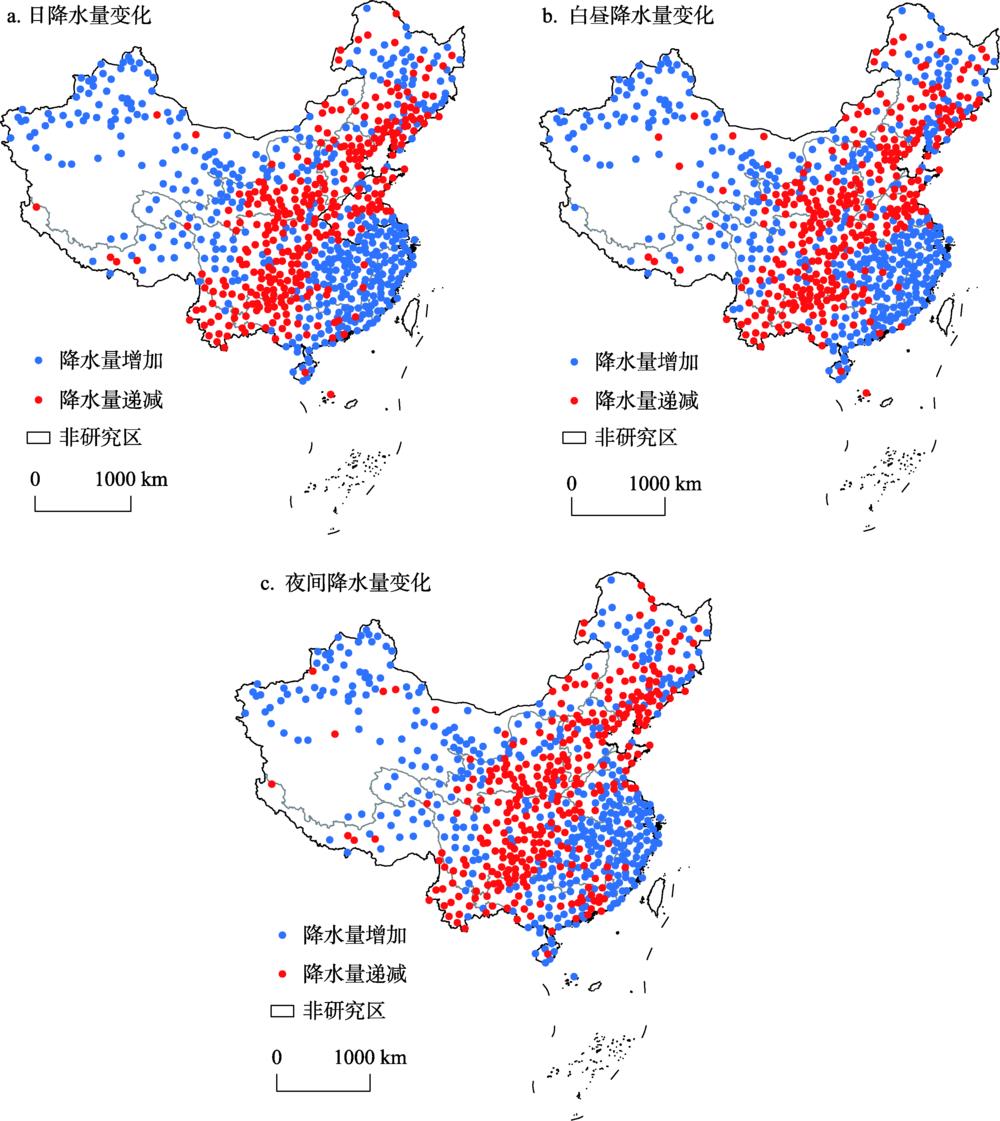
Fig. 2. Spatial pattern of precipitation variations in China from 1961 to 2016
Fig. 3. The changes in frequency and amount of precipitation in daytime and nighttime over China from 1961 to 2016; (a) and (b) are frequency of precipitation in daytime and nighttime, respectively; (c) and (d) are amount of precipitation in daytime and nighttime, respectively
Fig. 4. The changes of daytime and nighttime extremes precipitation (including heavy rain and torrential rain) in China from 1961 to 2016; (a) and (b) are frequencies of daytime and nighttime extreme precipitation, respectively; (c) and (d) are amount of daytime and nighttime extreme precipitation, respectively
Fig. 5. The changes in the frequencies (day) and amounts (mm) of daytime and nighttime extremes precipitation (heavy rain and torrential rain) in the nine river basins of China from 1961 to 2016. (a) and (b) are the heavy rain and torrential rain of daytime, (c) and (d) are the heavy rain and torrential rain of nighttime
Fig. 6. The contributions of annual daytime and nighttime heavy rain and torrential rain to annual precipitation in the nine river basins of China during 1961-2016
Fig. 7. The contributions of annual daytime and nighttime heavy rain and torrential rain to annual precipitation in the nine river basins of China in different periods. (a) represents the contribution of daytime heavy rain, (b) represents the contribution of daytime torrential rain, (c) represents the contribution of nighttime heavy rain, and (d) represents the contribution of nighttime torrential rain
|
Table 1. The study on daytime and nighttime precipitation changes based on station data in China
|
Table 2. Average annual precipitation and arid/humid conditions in the nine river basins of China
|
Table 3. Daytime and nighttime precipitation changes in the nine river basins of China during 1961-2016


Set citation alerts for the article
Please enter your email address

© Copyright 2018-2021 | Chinese Laser Press. All Rights Reserved 沪ICP备15018463号-20