
Baojun Zhu, Zhe Zhang, Chang Liu, Dawei Yuan, Weiman Jiang, Huigang Wei, Fang Li, Yihang Zhang, Bo Han, Lei Cheng, Shangqing Li, Jiayong Zhong, Xiaoxia Yuan, Bowei Tong, Wei Sun, Zhiheng Fang, Chen Wang, Zhiyong Xie, Neng Hua, Rong Wu, Zhanfeng Qiao, Guiyun Liang, Baoqiang Zhu, Jianqiang Zhu, Shinsuke Fujioka, Yutong Li. Observation of Zeeman splitting effect in a laser-driven coil[J]. Matter and Radiation at Extremes, 2022, 7(2): 024402
- Matter and Radiation at Extremes
- Vol. 7, Issue 2, 024402 (2022)
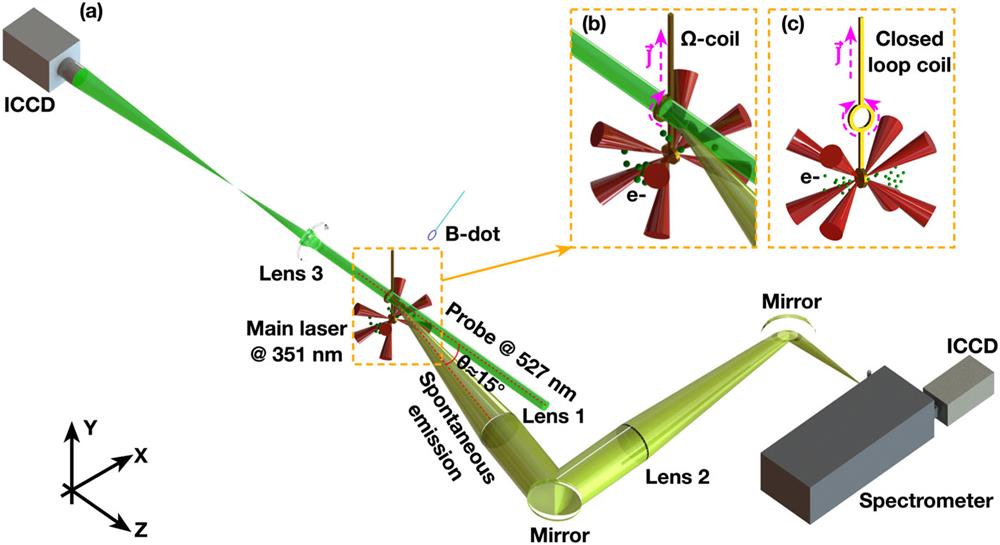
Fig. 1. (a) Experimental setup. (b) Configuration of Ω-shaped coil. (c) Configuration of closed-loop coil.
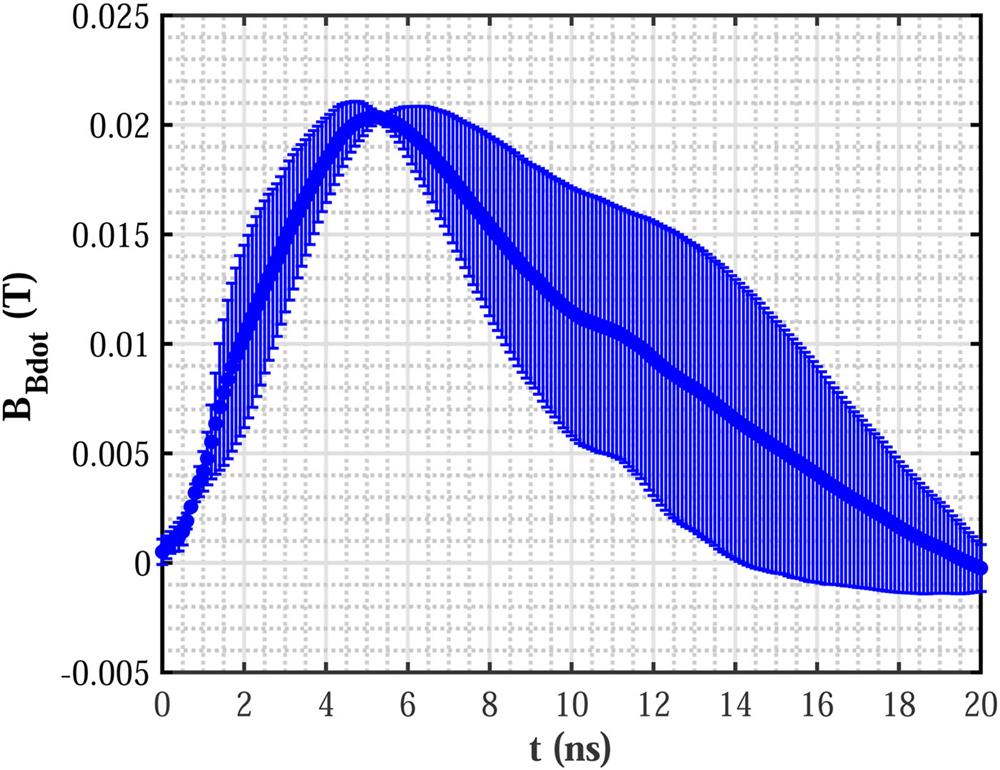
Fig. 2. Temporal evolution of the measured B-field strength at the position of the B-dot probe. The vertical error bars correspond to the standard deviation of two shots.
Fig. 3. Calculated two-dimensional magnetic field distribution in the x –y plane at z = 0: (a) Ω-shaped coil; (b) closed-loop coil.
Fig. 4. Shadowgraphs in the x –y plane: (a) before laser shot; (b) at a delay time t = 3.5 ns; (c) at a delay time t = 6.0 ns. The dark regions demonstrate that the plasma density is so high that the probe light cannot penetrate it.
Fig. 5. (a) Comparison between the observed spectra from the Ω-shaped and closed-loop coils and the Cu I spectrum obtained from the NIST Atomic Spectra Database at T e = 0.8 eV. (b) Comparison between the observed spectrum from the closed-loop coil and calculated spectra: the red dashed curve is the Voigt fitting for the closed-loop coil spectrum at 521.47 nm, and the green dotted curve is one typical PrismSPECT Cu I line shape convolved with instrumental broadening computed at T e = 0.8 eV and n e = 2 × 1017 cm−3. (c) Comparison between the observed spectrum from the Ω-shaped coil and the calculated Voigt spectrum.
Fig. 6. FWHM of line at transition (3) as a function of electron density n e computed with PrismSPECT at T e = 0.8 eV.
|
Table 1. Summary of spectra.


Set citation alerts for the article
Please enter your email address

© Copyright 2018-2021 | Chinese Laser Press. All Rights Reserved 沪ICP备15018463号-20