
Pengfei Wang, Kun Yang, Mingzhi Chen, Zhandong Wang, Yi Lu, Guifang Sun, Zhonghua Ni. Simulation and Experimental Research on the GH3536 Molten Pool Laser Cladding on Inclined Substrate[J]. Chinese Journal of Lasers, 2021, 48(10): 1002121
- Chinese Journal of Lasers
- Vol. 48, Issue 10, 1002121 (2021)
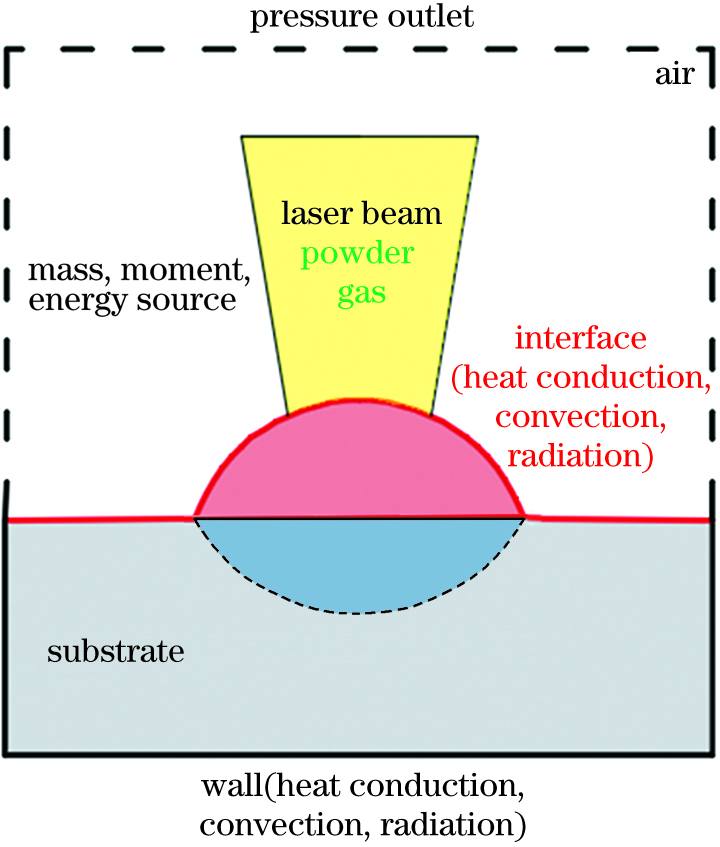
Fig. 1. Boundary conditions of the model
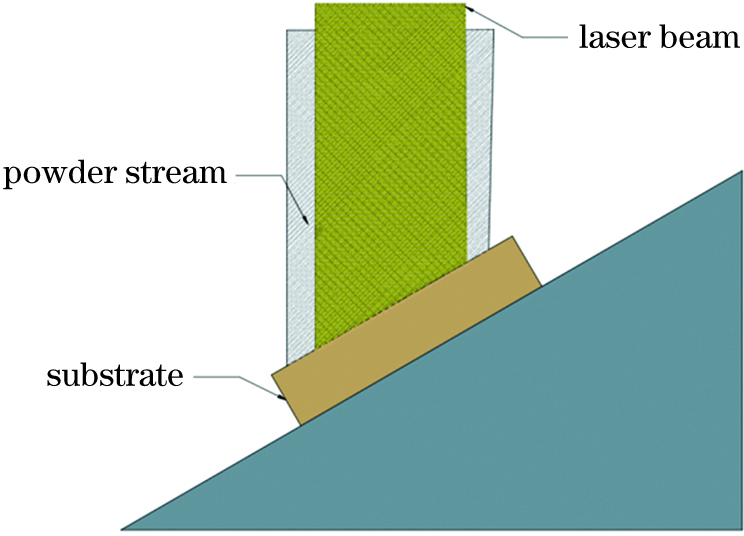
Fig. 2. Laser beam and powder work on the surface of the inclined substrate
Fig. 3. Main effect diagrams of laser power, powder mass flow and scanning rate varying with melting height. (a) Laser power; (b) powder mass flow; (c) scanning speed
Fig. 4. Main effect graphs of laser power, powder mass flow and scanning speed varying with aspect ratio. (a) Laser power; (b) powder mass flow; (c) scanning speed
Fig. 5. Simulated cladding profile and temperature cloud after 0.8 s cladding
Fig. 6. Comparison of simulation and experimental cladding profile and penetration. (a)(c) Simulated temperature cloud picture at 0.4 s and its experimental corrosion metallographic diagram; (b)(d) simulated metal liquid volume picture at 0.8 s and its experimental corrosion metallographic diagram
Fig. 7. Melting height change graph in the experiment 10--25
Fig. 8. Temperature of the simulated molten pool center
Fig. 9. Comparison of the inclination angle of the cladding layer between the simulation and the experiment at various inclination angles. (a)(f) 0°; (b)(g) 20°; (c)(h) -20°;(d)(i) 40°; (e)(j) -40°
Fig. 10. Front slope angle of the cladding layer changes with the inclination angle of the substrate
Fig. 11. Internal flow field of the cladding layer under the inclined substrate.(a) 0°; (b) 20°; (c) -20°; (d) 40°; (e) -40°
|
Table 1. Chemical composition of GH3536 unit:%
| ||||||||||||||||||||||||||||||||||||||||||||||||||||||||||||||||||||||||||||||||||||||||||||||||||||||||||||||||||||||||||||||||||||||||||||||||||||||||||||||||||||||||||||||||||||||||||||||||||||||||||||||||||||||||||||||||||||||||||||||||||||||||||||||||||||||||||||||||||||||||||||||||||||||||||||||||||||||||||||||||||||||||||||||||||||||||||||||||||||||||||||
Table 2. Single-track cladding experiment data

Set citation alerts for the article
Please enter your email address
© Copyright 2018-2021 | Chinese Laser Press. All Rights Reserved 沪ICP备15018463号-20