• Acta Physica Sinica
  • Vol. 69, Issue 16, 164101-1 (2020)
Ren Wang, Sheng Liu, Mo-Ran Zhang, and Bing-Zhong Wang*
Author Affiliations
  • Institute of Applied Physics, University of Electronic Science and Technology of China, Chengdu 610054, China
  • show less
    DOI: 10.7498/aps.69.20200271 Cite this Article
    Ren Wang, Sheng Liu, Mo-Ran Zhang, Bing-Zhong Wang. Slowly spreading propagation characteristics of flying electromagnetic toroid[J]. Acta Physica Sinica, 2020, 69(16): 164101-1 Copy Citation Text show less
    Schematic of TM FET.
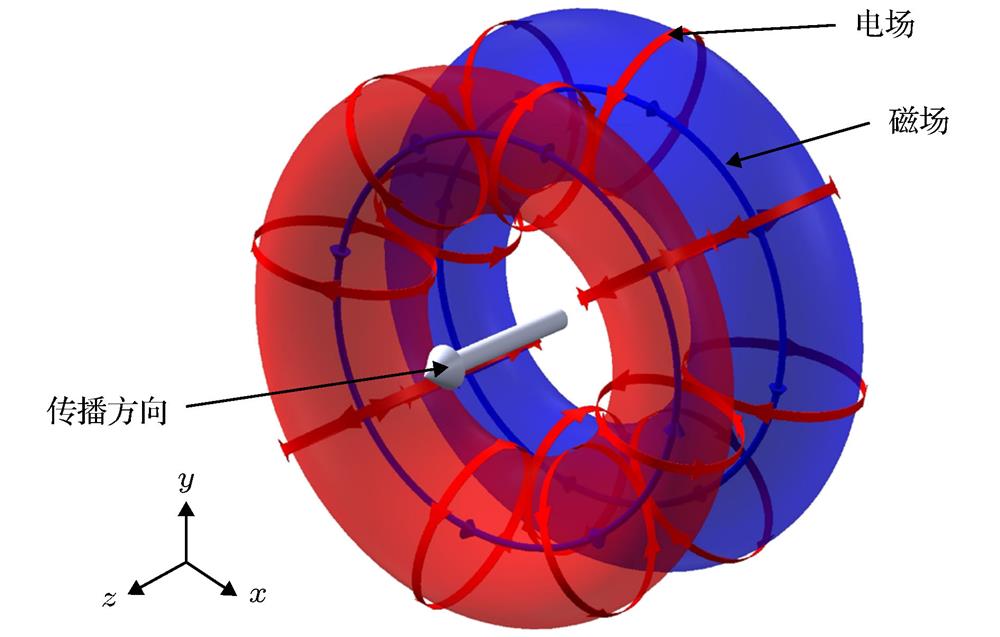
    Fig. 1. Schematic of TM FET.
    Field distribution of the FET when t = 0: (a) Ez on the y = 0 plane; (b) Eρ on the y = 0 plane; (c) Hθ on the y = 0 plane; (d) Ez on the z = 0 plane; (e) Eρ on the z = – q1 plane; (f) Hθ on the z = – q1 plane.
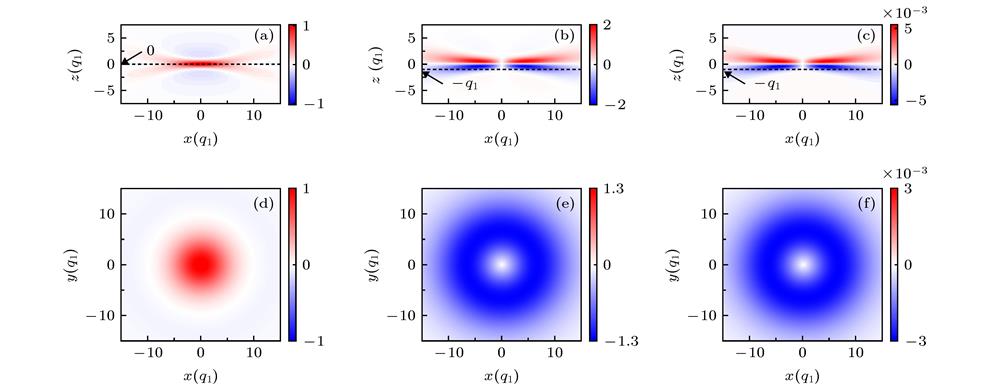
    Fig. 2. Field distribution of the FET when t = 0: (a) Ez on the y = 0 plane; (b) Eρ on the y = 0 plane; (c) Hθ on the y = 0 plane; (d) Ez on the z = 0 plane; (e) Eρ on the z = – q1 plane; (f) Hθ on the z = – q1 plane.
    Field distribution along z direction when t = 0: (a) on the line ρ = 0; (b) on the line (x = 4.5q1, y = 0) of cylindrical surface ρ = 4.5q1.
    Fig. 3. Field distribution along z direction when t = 0: (a) on the line ρ = 0; (b) on the line (x = 4.5q1, y = 0) of cylindrical surface ρ = 4.5q1.
    Evolution of the field distribution of FET: (a) Longitudinal electric field Ez; (b) transverse electric field Eρ, the black line indicates the position of maximum transverse electric field when the FET propagates to different positions.
    Fig. 4. Evolution of the field distribution of FET: (a) Longitudinal electric field Ez; (b) transverse electric field Eρ, the black line indicates the position of maximum transverse electric field when the FET propagates to different positions.
    Position of maximum transverse electric field when the FET propagates to different positions: (a) z q2; (b) z > q2.
    Fig. 5. Position of maximum transverse electric field when the FET propagates to different positions: (a) z < q2; (b) z > q2.
    Normalized spectrum distribution when the FET propagates through the z = 0 plane: (a) Longitudinal electric field Ez; (b) transverse electric field Eρ.
    Fig. 6. Normalized spectrum distribution when the FET propagates through the z = 0 plane: (a) Longitudinal electric field Ez; (b) transverse electric field Eρ.
    Position curves of maximum value of each frequency of the transverse electric field Eρ.
    Fig. 7. Position curves of maximum value of each frequency of the transverse electric field Eρ.
    传输距离z/q1环半径ρ/q1扩散百分比/%
    04.50
    104.73
    204.98
    305.3518
    405.827
    506.3540
    60754
    707.769
    808.4586
    909.35105
    10010.05121
    11010.9140
    12011.8159
    13012.35171
    14013.5197
    15014.3214
    16015.15233
    17015.95251
    18016.75268
    19017.55286
    Table 1. Relation between propagation distance and toroid radius of FET.
    Ren Wang, Sheng Liu, Mo-Ran Zhang, Bing-Zhong Wang. Slowly spreading propagation characteristics of flying electromagnetic toroid[J]. Acta Physica Sinica, 2020, 69(16): 164101-1
    Download Citation