• Chinese Journal of Lasers
  • Vol. 45, Issue 8, 807002 (2018)
Liu Qimeng, Huang Jun*, Wang Kehong, and Zhou Qi
Author Affiliations
  • [in Chinese]
  • show less
    DOI: 10.3788/CJL201845.0807002 Cite this Article Set citation alerts
    Liu Qimeng, Huang Jun, Wang Kehong, Zhou Qi. Multivariate Nonlinear Regression Model of Laser Fusion in vitro Skin Tissue Incision Performance Based on Response Surface Methodology[J]. Chinese Journal of Lasers, 2018, 45(8): 807002 Copy Citation Text show less
    (a) In vitro biological tissue test sample; (b) experimental setup
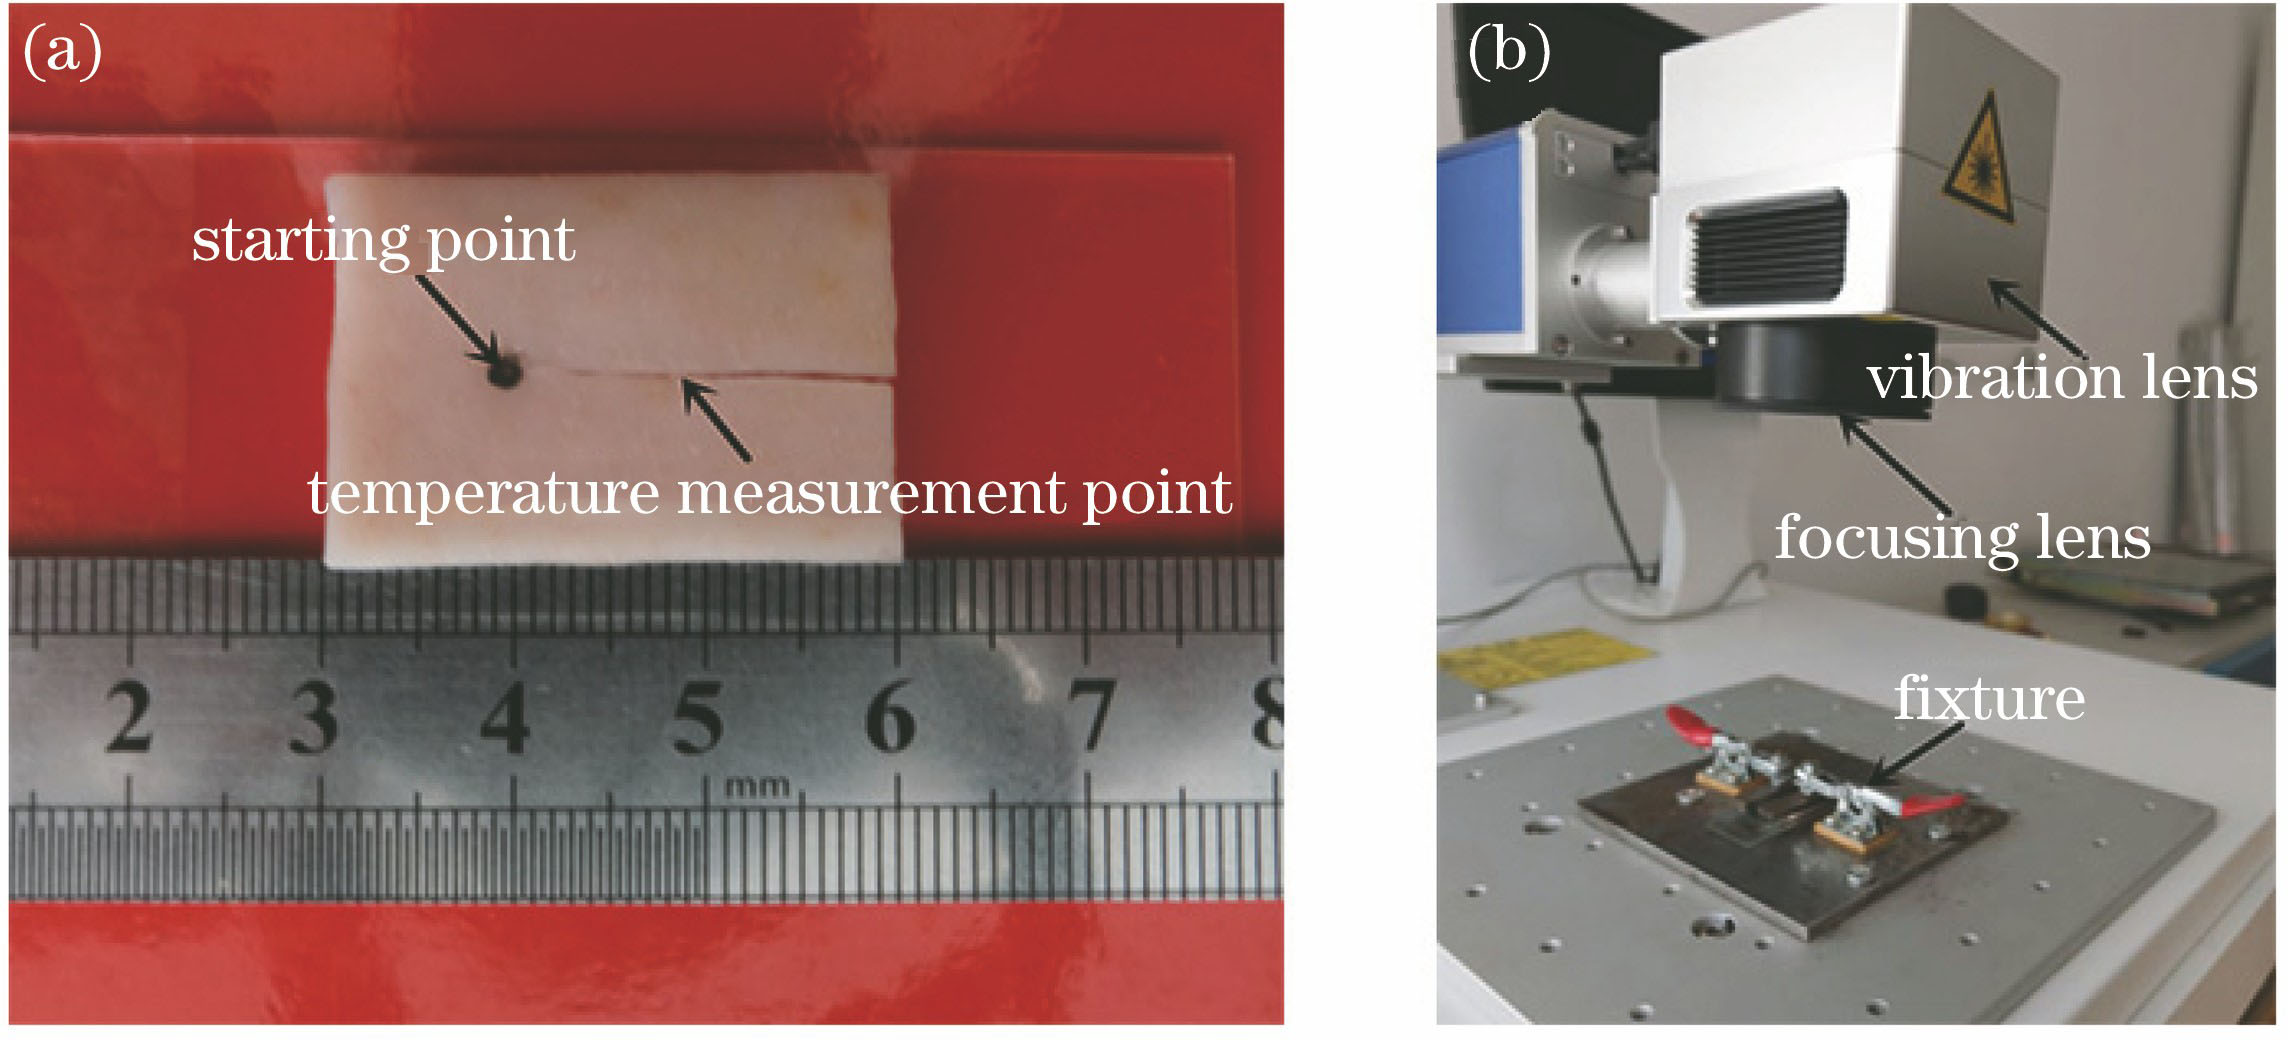
    Fig. 1. (a) In vitro biological tissue test sample; (b) experimental setup
    (a) Measuring peak temperature of incision; (b) measuring tensile strength
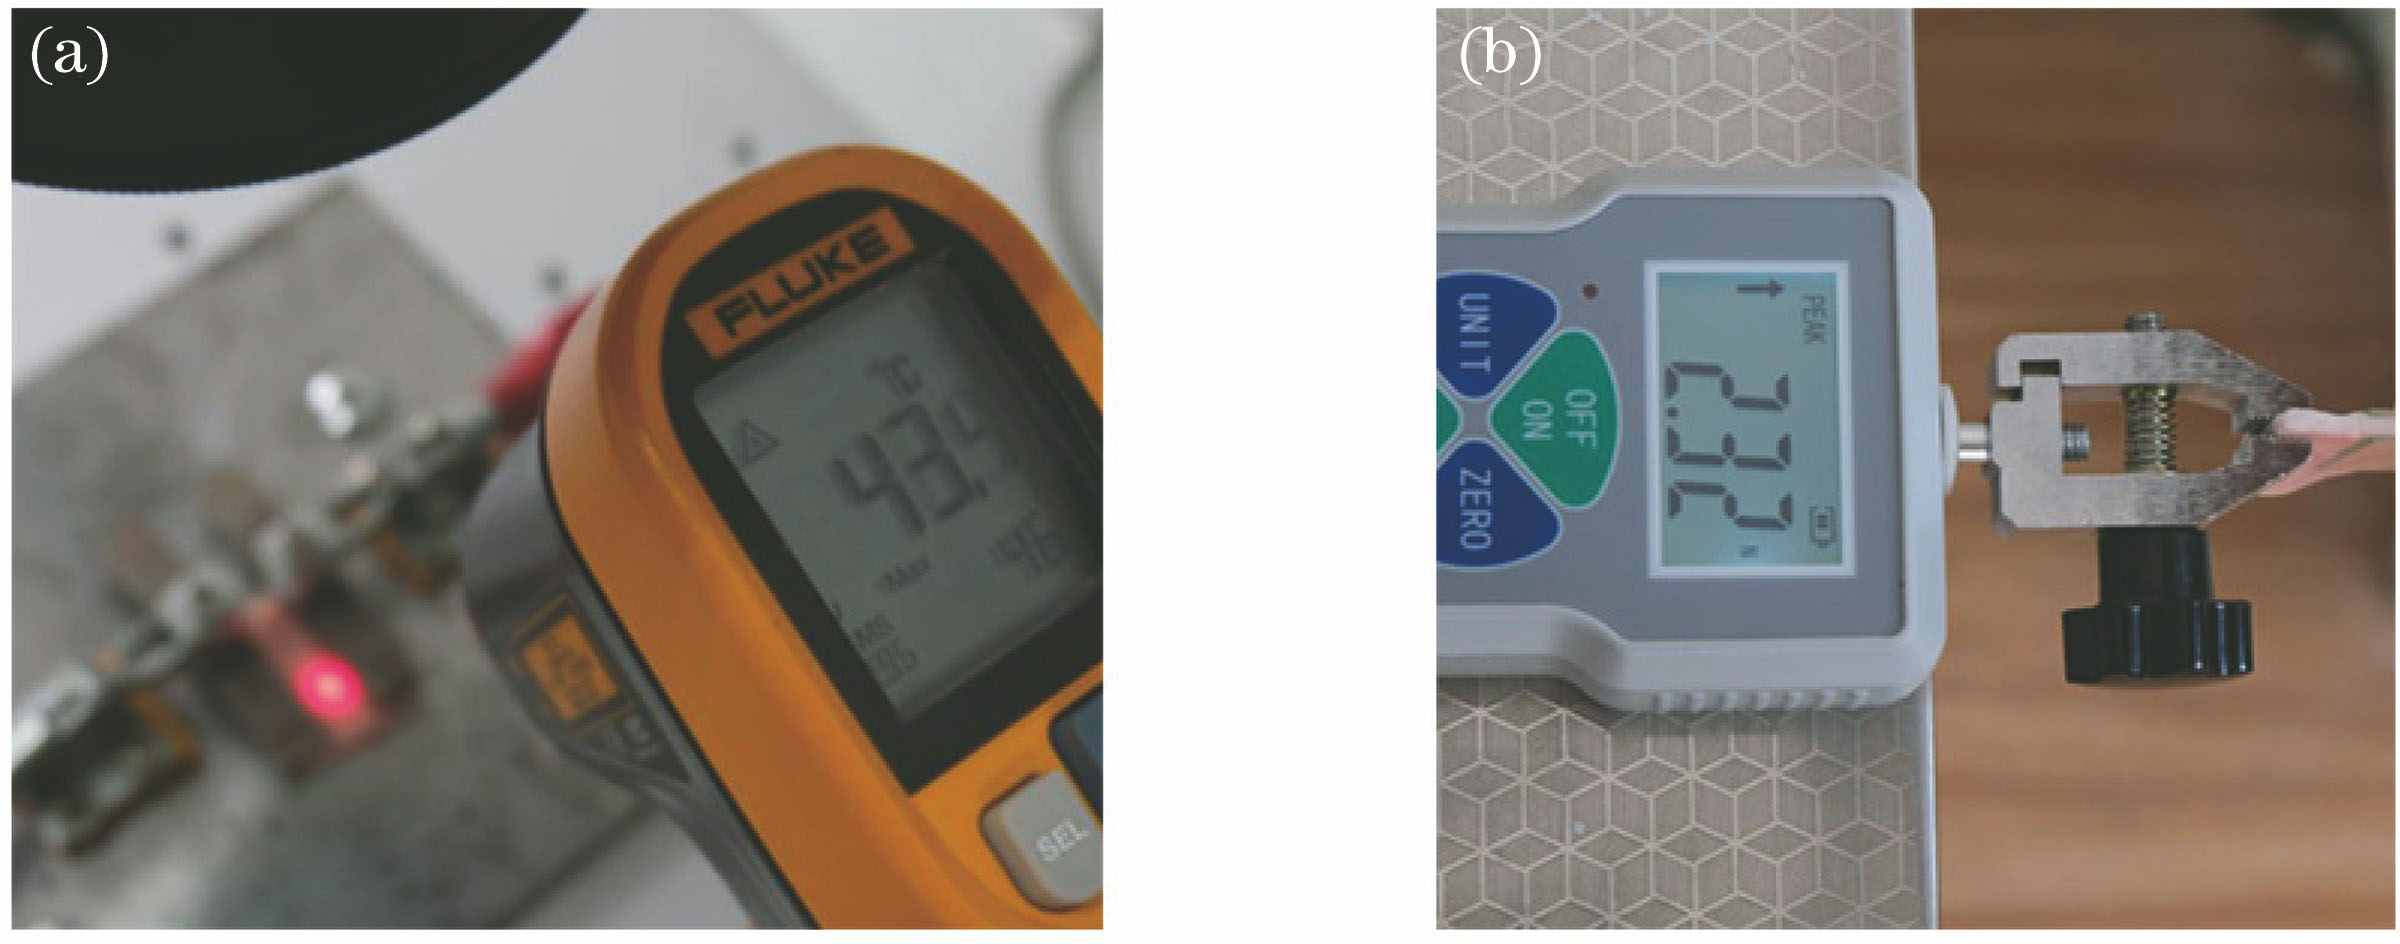
    Fig. 2. (a) Measuring peak temperature of incision; (b) measuring tensile strength
    Peak temperature changing curve of sample during welding
    Fig. 3. Peak temperature changing curve of sample during welding
    Tensile strength dispersion map
    Fig. 4. Tensile strength dispersion map
    Peak temperature dispersion map
    Fig. 5. Peak temperature dispersion map
    (a) Three-dimensional surface map and (b) contour map showing the effects of laser power and spot movement speed on tensile strength
    Fig. 6. (a) Three-dimensional surface map and (b) contour map showing the effects of laser power and spot movement speed on tensile strength
    Three-dimensional surface maps and contour maps showing the effects of factor interactions on peak temperature of in vitro skin tissue incision. (a)-(b) Spot movement speed and laser power; (c)-(d) laser frequency and laser power; (e)-(f) laser frequency and spot movement speed
    Fig. 7. Three-dimensional surface maps and contour maps showing the effects of factor interactions on peak temperature of in vitro skin tissue incision. (a)-(b) Spot movement speed and laser power; (c)-(d) laser frequency and laser power; (e)-(f) laser frequency and spot movement speed
    Fusion morphology of in vitro skin tissue at optimized parameters. (a) Front view; (b) back view; (c) cross-section
    Fig. 8. Fusion morphology of in vitro skin tissue at optimized parameters. (a) Front view; (b) back view; (c) cross-section
    WeldingparameterEncodingvalueCoding level
    -101
    P /WX133.54
    v /(mm·s-1)X2150200250
    F /HzX350100150
    Table 1. Horizontal coding and real value table of laser welding parameters
    NumberX1X2X3σb /(N·cm-2)T /℃
    12345678910111213141516170 1 0 1 1 0 0-1-1 0-1 0 1 0 0-1 01 0-1 1-1 0 1-1 1 0 0-1 0 0 0 0 01-1-1 0 0 0-1 0 0 0-1 1 1 0 0 1 038.127.440.229.035.743.637.520.127.744.726.028.844.545.840.422.845.049.054.050.053.558.053.549.042.039.853.740.753.356.453.153.540.854.0
    Table 2. Experimental laser welding parameters and results
    SourceSum of squaresDegree of freedomMean squareF valuep-value (P'>F)Source
    Model1081.599120.188.1700.0056Significant
    X1200.001200.0013.6000.0078Significant
    X27.0317.030.4800.5115-
    X31.2011.200.0820.7833-
    X1X251.12151.123.4800.1045Significant
    X1X3103.021103.027.0100.0331-
    X2X336.00136.002.4500.1616-
    X12497.961497.9633.8700.0007Significant
    X22101.091101.096.8800.0343Significant
    X3234.20134.202.3300.1711-
    Residual102.93714.70---
    Lack of fit85.13328.386.3800.0527Not significant
    Pure error17.8044.45---
    Total deviation1184.5216----
    Table 3. Variance analysis for the tensile strength of in vitro skin tissue incision
    SourceSum of squaresDegree of freedomMean squareF valuep-value (P'>F)Source
    Model547.15960.79508.43<0.0001Significant
    X1429.251429.253589.86<0.0001Significant
    X218.00118.00150.54<0.0001Significant
    X34.2114.2135.170.0006Significant
    X1X21.3211.3211.060.0127Significant
    X1X31.3211.3211.060.0127Significant
    X2X32.7212.7222.770.0020Significant
    X1260.56160.56506.48<0.0001Significant
    X228.7618.7673.27<0.0001Significant
    X3213.53113.53113.14<0.0001Significant
    Residual0.8470.12---
    Lack of fit0.4130.14-0.4028Not significant
    Pure error0.4340.11---
    Total deviation547.9816----
    Table 4. Variance analysis for peak temperature of in vitro skin tissue incision
    Factorencoding valueσb /(N·cm-2)T /℃
    PvFPvF
    -1.0024.1531.2032.7740.8250.8348.43
    -0.7530.3533.9134.5044.3951.2249.52
    -0.5035.1335.9235.7647.4651.3950.35
    -0.2538.5037.2136.5650.0451.3550.92
    040.4637.8036.8952.1251.0851.23
    0.2541.0037.6836.7553.7050.6051.28
    0.5040.1336.8636.1554.7949.8951.07
    0.7537.8535.3235.0855.3848.9750.60
    1.0034.1533.0833.5555.4847.8349.87
    Table 5. Tensile strength and peak temperature response values for single factor effect
    Sample numberσb /(N·cm-2)T /℃
    143.955.0
    244.754.5
    342.356.3
    442.155.6
    546.555.4
    643.256.0
    744.154.5
    844.056.7
    942.155.3
    1043.555.0
    Average value43.655.4
    Predicted value44.855.3
    Table 6. Tensile strength and peak temperature of experimental samples incision
    Liu Qimeng, Huang Jun, Wang Kehong, Zhou Qi. Multivariate Nonlinear Regression Model of Laser Fusion in vitro Skin Tissue Incision Performance Based on Response Surface Methodology[J]. Chinese Journal of Lasers, 2018, 45(8): 807002
    Download Citation