
Hao Wang, Yining Hu, Tao Wang. Microstructure and Tribological Properties of Additively Manufactured TC17 Titanium Alloy Under Different Heat Treatment Processes[J]. Chinese Journal of Lasers, 2024, 51(12): 1202301
- Chinese Journal of Lasers
- Vol. 51, Issue 12, 1202301 (2024)
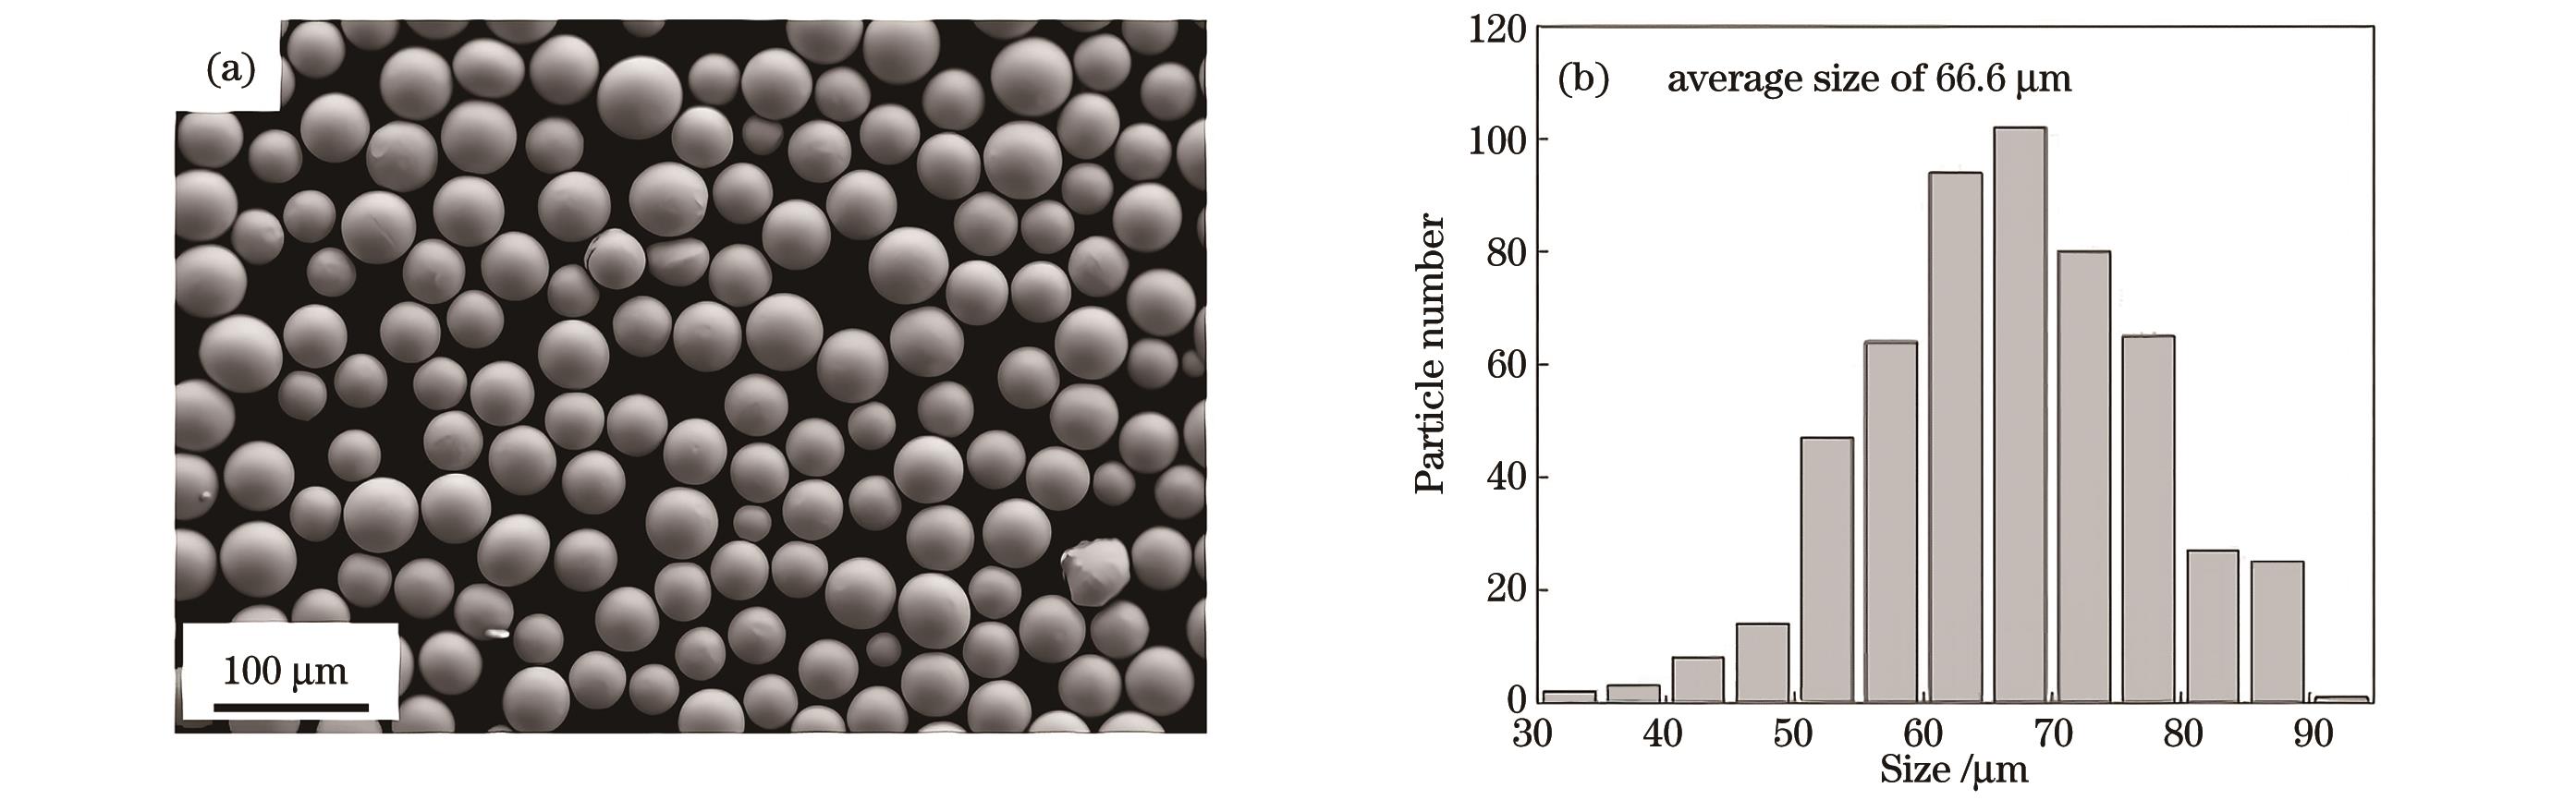
Fig. 1. Morphology and particle size distribution of TC17 alloy powder. (a) Morphology; (b) particle size distribution
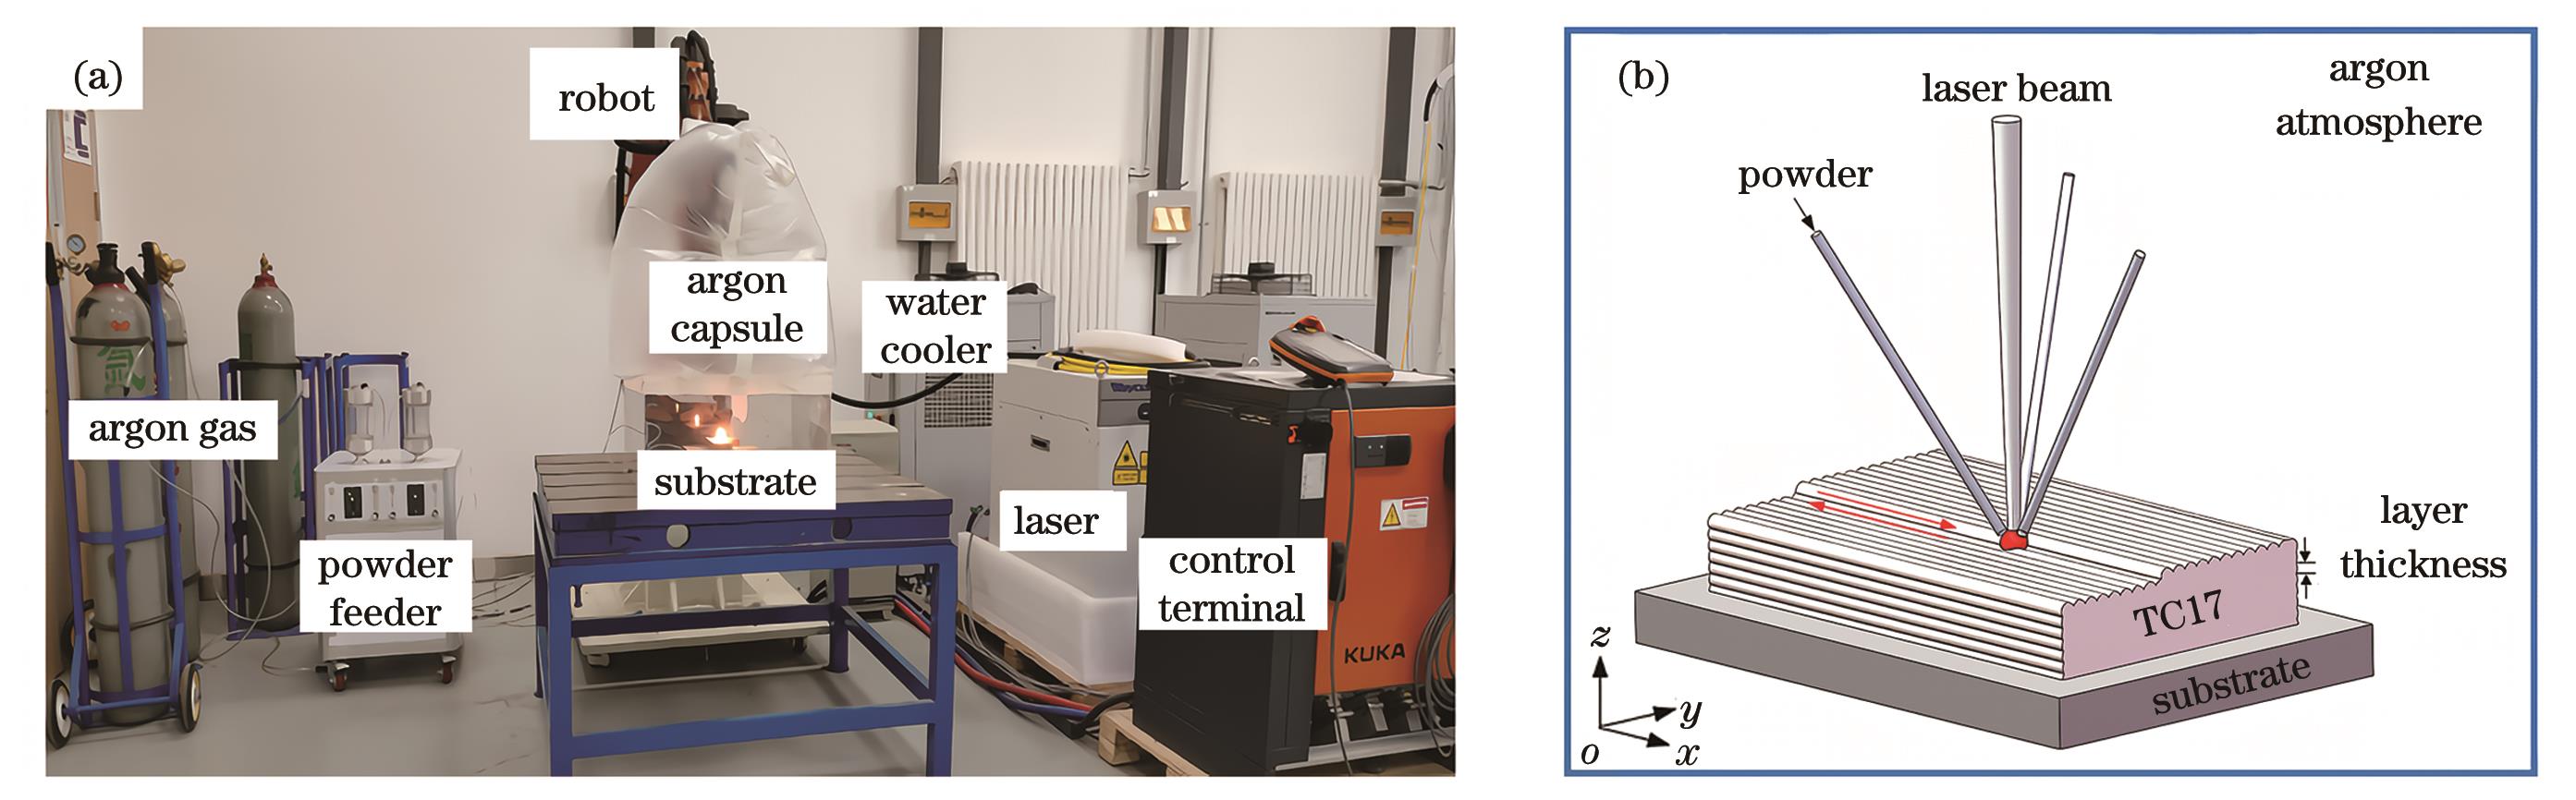
Fig. 2. DED process. (a) Experimental environment; (b) TC17 alloy deposition process
Fig. 3. Heat treatment process of TC17 alloy
Fig. 4. Pin disc wear diagram
Fig. 5. XRD spectra of TC17 alloy. (a) 2θ=30°‒90°; (b) local magnification of Fig. 5(a)
Fig. 6. Microstructure of as-deposited TC17. (a) Microstructure; (b) local magnification of Fig. 6(a)
Fig. 7. Microstructures of TC17 alloys. (a1)‒(a3) 840 ℃ pre-annealing; (b1)‒(b3) pre-annealing+800 ℃ solution
Fig. 8. Elemental fluctuation of TC17 alloy in scanning path after 840 ℃ pre-annealing and 800 ℃ solution. (a) Scanning path; (b) elemental signal intensity
Fig. 9. Microstructures of TC17 alloy under different aging conditions after 840 ℃ pre-annealing and 800 ℃ solution. (a1)‒(a3) 580 ℃ aging; (b1)‒(b3) 630 ℃ aging; (c1)‒(c3) 680 ℃ aging
Fig. 10. α phase sizes and volume fraction in TC17 alloy. (a) Length of αP phase; (b) width of αP phase; (c) widths of αGB phase and PFZ; (d) volume fraction of α phase
Fig. 11. Microstructure evolution of TC17 alloy during heat treatment. (a) Pre-annealing; (b) solution after pre-annealing; (c) aging at 580 ℃ after pre-annealing and solution; (d) aging at 630 ℃ after pre-annealing and solution; (e) aging at 680 ℃ after pre-annealing and solution
Fig. 12. Microhardness of TC17 alloys in deposition and heat treatment states. (a) Microhardness curves; (b) average microhardness
Fig. 13. Test results of wear properties of TC17 alloy. (a) Friction coefficient curves; (b) average friction coefficients during steady wear phase; (c) wear rate; (d) two dimensional wear profile
Fig. 14. Wear surfaces of TC17 alloy in deposition and heat treatment states. (a) Deposition; (b) pre-annealing; (c) solution after pre-annealing; (d) aging at 580 ℃ after pre-annealing and solution; (e) aging at 630 ℃ after pre-annealing and solution; (f) aging at 680 ℃ after pre-annealing and solution
|
Table 1. Chemical compositions of TC17 alloy powder (mass fraction, %)
|
Table 2. 2θ and FWHM at peak 1
|
Table 3. Maximum wear widths and depths of TC17 alloys in deposition and heat treatment states
| |||||||||||||||||||||||||||||||||||||||||||||||||||||||||||||||
Table 4. EDS analysis results of oxide layer of TC17 alloy in deposition and heat treatment states

Set citation alerts for the article
Please enter your email address
© Copyright 2018-2021 | Chinese Laser Press. All Rights Reserved 沪ICP备15018463号-20